△Click on the top right corner to try Wukong CRM for free
Guidelines for Writing CRM Survey Reports: A Practical Approach
Customer Relationship Management (CRM) has become a cornerstone of modern business strategy. Companies invest heavily in CRM systems not just to manage contacts, but to understand customer behavior, anticipate needs, and drive long-term loyalty. One of the most effective ways to gather actionable insights is through well-designed CRM surveys. However, collecting data is only half the battle—the real value lies in how that data is interpreted and communicated. That’s where CRM survey reports come in. A strong report doesn’t just present numbers; it tells a story that informs decisions, aligns teams, and ultimately improves the customer experience.
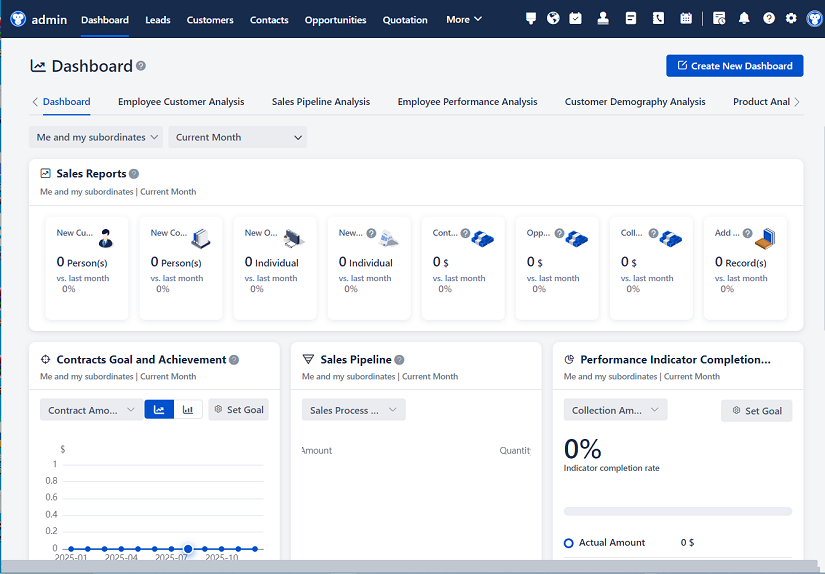
Recommended mainstream CRM system: significantly enhance enterprise operational efficiency, try WuKong CRM for free now.
Over the years, I’ve seen countless CRM survey reports—some that sparked immediate action, others that gathered digital dust. The difference often comes down to clarity, relevance, and structure. Below are practical guidelines I’ve developed through trial, error, and collaboration with cross-functional teams. These aren’t theoretical best practices pulled from a textbook; they’re grounded in real-world application.
1. Start with a Clear Purpose
Before you write a single word, ask yourself: Why does this report exist? Is it to identify pain points in the onboarding process? To measure satisfaction after a support interaction? To track changes in Net Promoter Score (NPS) over time? Your answer will shape everything—from the data you highlight to the tone you use.
Too often, reports try to do too much. They include every metric under the sun, hoping something sticks. But decision-makers don’t have time to sift through noise. Be ruthless about relevance. If your goal is to improve post-purchase follow-up, focus on metrics tied to that journey stage. Leave out tangential data, even if it’s interesting. Save it for an appendix or a separate deep-dive.
2. Know Your Audience
A report for the C-suite looks different from one for the customer support team. Executives want high-level trends, strategic implications, and ROI. Frontline managers need actionable items, specific feedback quotes, and clear next steps.
When I worked with a mid-sized SaaS company, we initially sent the same 15-page report to everyone. Engagement was low. Then we started tailoring versions: a one-page executive summary with key takeaways and visual dashboards for leadership, and a detailed operational report with verbatim comments and workflow suggestions for support leads. The result? Faster implementation of changes and higher buy-in across departments.
Ask: Who will read this? What decisions will they make based on it? What level of detail do they need? Answering these questions upfront saves time and increases impact.
3. Structure for Scannability
Let’s be honest—most people skim reports. They’ll read headings, glance at charts, and maybe dive into a few key sections. Design your report accordingly.
Use a consistent, logical flow:
- Executive Summary: 3–5 bullet points capturing the essence.
- Objectives & Methodology: Briefly explain what you measured and how (e.g., “Survey sent to 1,200 customers post-interaction; 32% response rate”).
- Key Findings: Group insights by theme (e.g., “Onboarding Experience,” “Support Responsiveness”).
- Data Visualizations: Charts that clarify, not confuse.
- Recommendations: Concrete, prioritized actions.
- Appendix (optional): Full data tables, survey questions, technical notes.
Avoid walls of text. Break content into short paragraphs. Use bold headers, bullet points, and white space generously. If someone can grasp the core message in under two minutes, you’ve succeeded.
4. Humanize the Data
Numbers alone rarely inspire change. Pair quantitative results with qualitative insights—actual customer quotes. A stat like “68% rated support as ‘slow’” becomes far more compelling when followed by: “I waited 45 minutes for a reply while my system was down. Felt completely ignored.”
But don’t just drop quotes randomly. Curate them to illustrate patterns. If multiple respondents mention confusing billing language, select one clear, representative quote and tie it directly to the metric. This bridges the gap between abstract data and real human frustration—or delight.
Also, avoid jargon. Terms like “churn propensity” or “touchpoint efficacy” might sound smart, but they alienate non-analysts. Say “likelihood to cancel” or “how well each interaction worked.” Clarity trumps cleverness.
5. Visuals That Add Value
Not all charts are created equal. A poorly designed pie chart with ten slices is worse than no chart at all. Follow these rules:
- Choose the right chart type: Use bar charts for comparisons, line graphs for trends over time, and heatmaps for satisfaction across multiple touchpoints.
- Label clearly: Axes, units, and sources should be obvious. Never force readers to guess.
- Highlight what matters: Use color strategically—e.g., red for declining scores, green for improvements. But don’t overdo it; too many colors create chaos.
- Keep it simple: Remove gridlines, excessive borders, or 3D effects that distract from the message.
I once replaced a cluttered dashboard with three clean visuals showing NPS trend, top drivers of satisfaction, and open-ended themes. The VP of Customer Success told me it was the first report she fully understood without asking for clarification.
6. Focus on Action, Not Just Analysis
The ultimate test of a CRM survey report is whether it leads to action. Every insight should connect to a recommendation. Don’t just say, “Customers are unhappy with response times.” Say, “To address slow response times, we recommend: (1) Hire two additional Tier 1 agents by Q3, (2) Implement canned responses for common queries, and (3) Set SLA alerts for tickets open >30 minutes.”
Prioritize recommendations using criteria like impact vs. effort. A simple 2x2 matrix (High/Low Impact vs. High/Low Effort) helps stakeholders decide where to start. And always assign owners—“Marketing to revise onboarding emails” is clearer than “Onboarding emails should be revised.”
7. Be Honest About Limitations
No survey is perfect. Maybe your response rate was low, or your sample skewed toward long-term customers. Acknowledge these limitations upfront. It builds credibility and prevents misinterpretation.
For example: “While our NPS increased by 8 points, note that only 22% of surveyed customers responded—primarily those who had recent positive experiences. We recommend supplementing with churn interviews for a fuller picture.”
Transparency doesn’t weaken your report; it strengthens trust.
8. Maintain Consistency Over Time
If you’re running recurring CRM surveys (and you should be), ensure your reporting format stays consistent. Use the same metrics, definitions, and visual styles quarter after quarter. This allows for meaningful trend analysis.
At one company, we changed the NPS question wording slightly between Q1 and Q2. The score jumped—but was it real improvement or just a wording artifact? We had to discard the comparison. Lesson learned: standardize everything.
Consider creating a report template. It saves time and ensures nothing critical gets missed during busy periods.
9. Tell a Story
Great reports don’t just list findings—they narrate a journey. Start with the customer’s perspective. What are they experiencing? Where are the friction points? Where are the bright spots?
Structure your narrative like this:
- The current state: What the data shows today.
- The gap: How it compares to goals or past performance.
- The cause: Why it’s happening (supported by data and quotes).
- The path forward: What to do about it.
This approach resonates emotionally and logically. People remember stories far longer than spreadsheets.
10. Review and Iterate
Never send a report without peer review. Ask a colleague unfamiliar with the project to read it. Can they understand the main points in five minutes? Do the recommendations feel realistic? Fresh eyes catch assumptions, ambiguities, and typos.
Also, solicit feedback on the report itself. After distributing it, ask recipients: “Was this useful? What would make it better next time?” Treat your reporting process like any other product—continuously improve it.
Final Thoughts
Writing an effective CRM survey report isn’t about fancy analytics or complex models. It’s about empathy—for both the customer whose voice you’re amplifying and the internal stakeholder who needs to act on that voice. Strip away the fluff. Focus on clarity, relevance, and actionability. And remember: the goal isn’t to impress with data—it’s to inspire change.
In my experience, the best reports feel less like documents and more like conversations. They invite discussion, spark ideas, and align teams around a shared mission: making the customer’s life easier. That’s the real power of CRM—not just managing relationships, but improving them, one insight at a time.
So the next time you sit down to write a CRM survey report, don’t think like an analyst. Think like a storyteller, a strategist, and an advocate for the customer. The numbers will follow.
Relevant information:
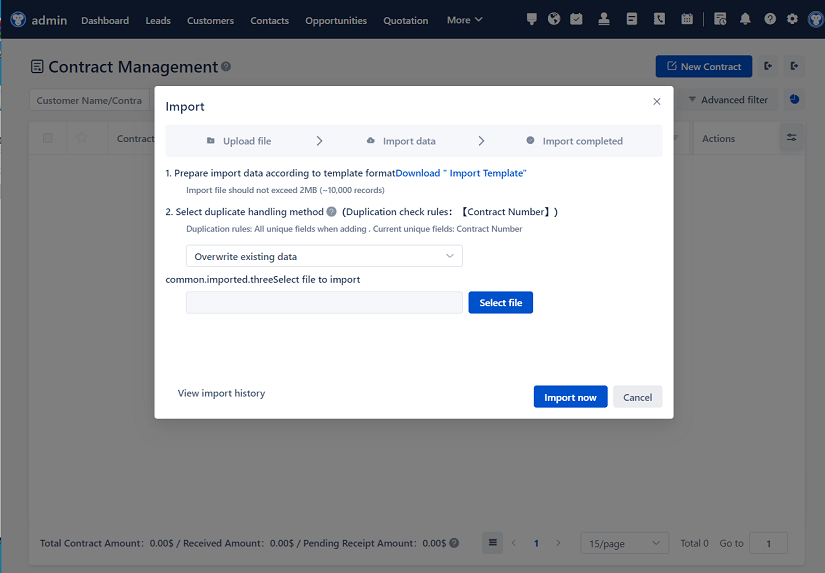
Significantly enhance your business operational efficiency. Try the Wukong CRM system for free now.
AI CRM system.