△Click on the top right corner to try Wukong CRM for free
Techniques for CRM Report Analysis: Turning Data into Actionable Insights
In today’s hyper-competitive business landscape, customer relationship management (CRM) systems have evolved from simple contact databases into sophisticated intelligence platforms. Yet, having a CRM filled with data doesn’t automatically translate into better decisions or stronger customer relationships. The real value lies not in collecting data—but in analyzing it effectively. This article explores practical, battle-tested techniques for CRM report analysis that go beyond surface-level metrics and help organizations uncover meaningful insights to drive growth, retention, and operational efficiency.
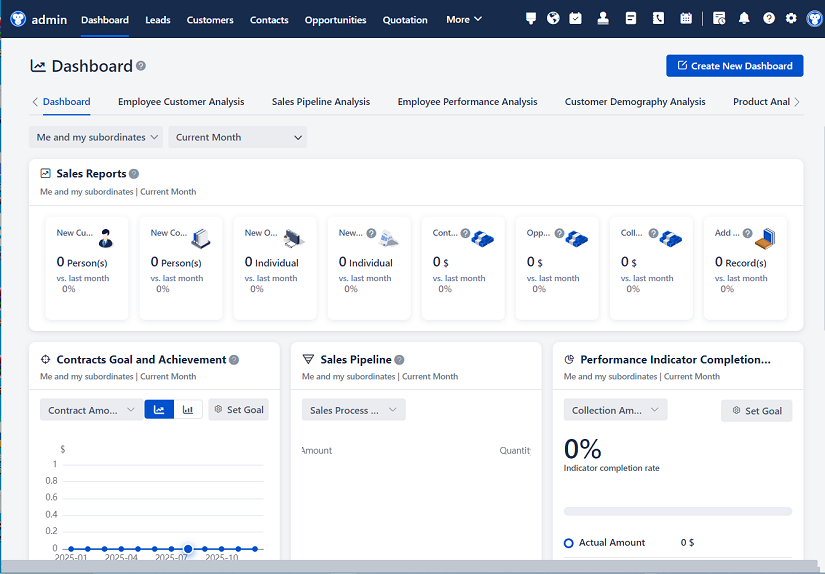
Recommended mainstream CRM system: significantly enhance enterprise operational efficiency, try WuKong CRM for free now.
1. Start with Clear Objectives—Not Just Data
One of the most common pitfalls in CRM reporting is diving straight into dashboards without asking, “What problem are we trying to solve?” Too often, teams generate reports simply because they can, not because they should. Before pulling any data, define your business question. Are you trying to reduce churn? Improve sales conversion rates? Identify upsell opportunities? Each objective demands a different analytical approach.
For example, if your goal is to understand why customers are leaving, don’t just look at overall churn rate. Segment your data by acquisition channel, product line, customer tenure, or support ticket history. This targeted questioning ensures your analysis remains focused and actionable.
2. Leverage Cohort Analysis for Behavioral Trends
Cohort analysis groups users based on shared characteristics or experiences within a defined time frame—such as sign-up month, first purchase date, or campaign exposure. Unlike static snapshots, cohort analysis reveals how behavior evolves over time.
Imagine two groups of customers acquired in January and July. At first glance, both may show similar initial engagement. But when tracked over six months, the January cohort might demonstrate higher retention and lifetime value. Why? Perhaps seasonal factors, onboarding improvements, or changes in marketing messaging played a role. By comparing cohorts, you isolate variables that impact long-term success and adjust strategies accordingly.
Most modern CRMs support cohort reporting out of the box, but the key is interpreting the patterns—not just generating the charts.
3. Map the Customer Journey with Funnel Analysis
Sales and service processes rarely follow a straight line. Customers drop off at various stages—whether during lead qualification, demo scheduling, or post-purchase onboarding. Funnel analysis helps visualize these drop-off points by tracking progression through predefined stages.
Start by defining your ideal customer journey within the CRM. For a B2B SaaS company, this might be: Lead → Qualified Lead → Demo Scheduled → Demo Completed → Proposal Sent → Closed Won. Then, use CRM data to calculate conversion rates between each stage.
If you notice a steep drop between “Demo Scheduled” and “Demo Completed,” the issue might lie in calendar conflicts, poor reminder systems, or lack of pre-call preparation. Armed with this insight, you can implement targeted fixes—like automated SMS reminders or better sales training—rather than guessing where to improve.
4. Use RFM Segmentation to Prioritize Customers
RFM—Recency, Frequency, Monetary—is a classic yet powerful segmentation model that classifies customers based on their purchasing behavior:
- Recency: How recently did they buy?
- Frequency: How often do they purchase?
- Monetary: How much do they spend?
By scoring customers on each dimension (e.g., 1–5 scale), you can group them into segments like “Champions” (high on all three), “At Risk” (high past value but low recent activity), or “Newcomers” (recent but infrequent buyers).
This segmentation enables personalized outreach. Champions might receive early access to new features; At-Risk customers could get win-back offers; Newcomers may benefit from educational content to encourage repeat purchases. Many CRMs allow custom fields or tags to automate RFM scoring, making it scalable across thousands of accounts.
5. Correlate CRM Data with External Sources
CRM data alone tells only part of the story. To gain deeper context, integrate it with other systems—marketing automation platforms, support ticketing tools, financial software, or even third-party data like social sentiment or economic indicators.
For instance, if your CRM shows declining deal velocity in Q3, cross-referencing with marketing campaign performance might reveal that a key email nurture sequence underperformed due to deliverability issues. Or, if support ticket volume spikes among high-value accounts, it could signal a product bug affecting your best customers—something invisible in sales reports alone.
APIs and middleware like Zapier or native integrations in platforms like Salesforce or HubSpot make this correlation increasingly accessible, even for non-technical teams.
6. Apply Predictive Indicators—Even Without AI
You don’t need machine learning to make predictions. Simple leading indicators derived from CRM data can forecast future outcomes with surprising accuracy.
Consider this: customers who attend two product webinars within 30 days of signup are 3x more likely to renew. Or, deals with more than three stakeholder contacts in the CRM have a 70% higher close rate. These patterns emerge from historical data and can be codified into rules.
Create custom fields in your CRM to track these predictive behaviors. Sales reps can then prioritize leads exhibiting high-propensity signals, while customer success managers can flag accounts missing key engagement milestones for proactive intervention.
7. Visualize Trends Over Time—Not Just Totals
A common mistake is focusing on aggregate numbers: “We closed $500K in deals last quarter.” While useful, this hides fluctuations and emerging patterns. Instead, plot key metrics over time—weekly, monthly, or quarterly—to spot trends, seasonality, or anomalies.
For example, tracking weekly lead-to-opportunity conversion rates might reveal a steady decline over three months, suggesting a deteriorating lead quality or ineffective qualification process. Similarly, monitoring average deal size by rep over time can highlight coaching opportunities or territory imbalances.
Use line charts, moving averages, or control charts to smooth out noise and emphasize directionality. Most CRM reporting tools now support time-series visualizations—take advantage of them.
8. Conduct Win/Loss Analysis Systematically
Why do deals succeed or fail? Many companies rely on anecdotal feedback, but structured win/loss analysis embedded in the CRM yields far richer insights.
After each closed deal (won or lost), require sales reps to log reasons using standardized dropdowns: pricing, competition, product fit, timing, etc. Over time, this creates a searchable database of deal outcomes.
Analyze this data to answer questions like: “Are we consistently losing to Competitor X in the healthcare vertical?” or “Do deals stall when legal review takes longer than 10 days?” These findings directly inform pricing strategy, competitive positioning, or internal process improvements.
To ensure consistency, tie win/loss logging to commission payouts or CRM hygiene audits—what gets measured gets managed.
9. Audit Data Quality Relentlessly
Garbage in, gospel out. No amount of sophisticated analysis compensates for poor data. Inaccurate contact info, inconsistent deal stages, or missing opportunity values render reports misleading at best, dangerous at worst.
Implement regular data audits:
- Run duplicate contact/account checks monthly.
- Validate required fields (e.g., deal amount, close date) before allowing stage progression.
- Use validation rules to enforce consistent naming conventions (e.g., “Proposal Sent” vs. “Sent Proposal”).
Assign data stewards per team—sales ops, marketing ops, or customer success ops—who monitor integrity and coach users on best practices. Clean data isn’t a one-time project; it’s an ongoing discipline.
10. Foster a Culture of Curiosity, Not Just Compliance
Finally, the most advanced CRM analytics fail if teams treat reporting as a checkbox exercise. Encourage curiosity. Ask “why” repeatedly. Challenge assumptions. Celebrate insights that led to real business impact—even small ones.
Hold monthly “data deep dives” where cross-functional teams review CRM reports together. Let marketing explain campaign influences on pipeline; let support share recurring pain points from tickets; let sales highlight market feedback. This collaborative approach surfaces connections no single department would see alone.
Moreover, empower frontline employees to explore data themselves. Provide lightweight training on CRM reporting features so account managers can slice their own book of business without waiting for BI teams. Democratizing access breeds ownership and faster iteration.
Conclusion: From Reports to Results
CRM report analysis isn’t about producing beautiful dashboards—it’s about driving better decisions. The techniques above—starting with clear questions, segmenting intelligently, integrating data sources, and fostering data literacy—are proven methods used by high-performing organizations to extract real value from their CRM investments.
Remember, the goal isn’t more data. It’s better understanding. Every report should answer a business question, challenge a hypothesis, or inspire an action. When your CRM analysis consistently does that, you’re not just managing relationships—you’re building a customer-centric engine for sustainable growth.
So next time you open your CRM reporting module, don’t ask, “What can I measure?” Ask, “What do I need to learn?” The difference is everything.
Relevant information:
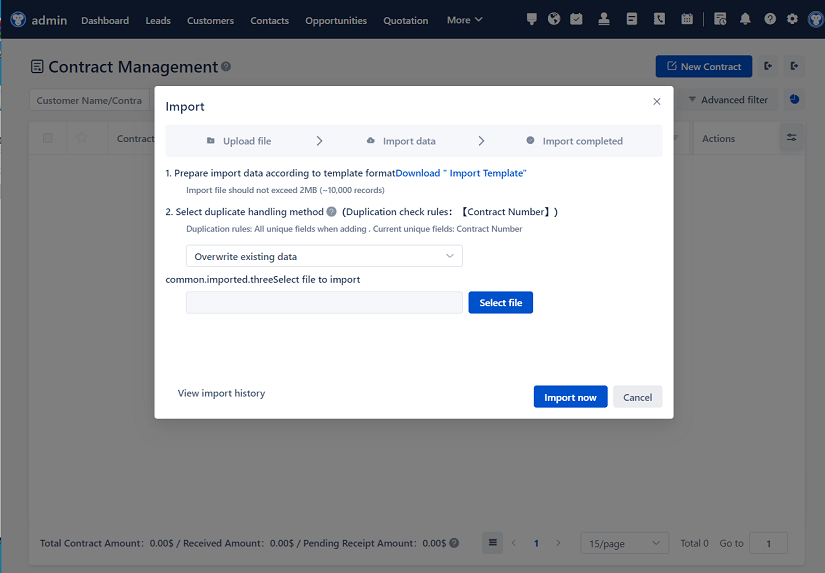
Significantly enhance your business operational efficiency. Try the Wukong CRM system for free now.
AI CRM system.