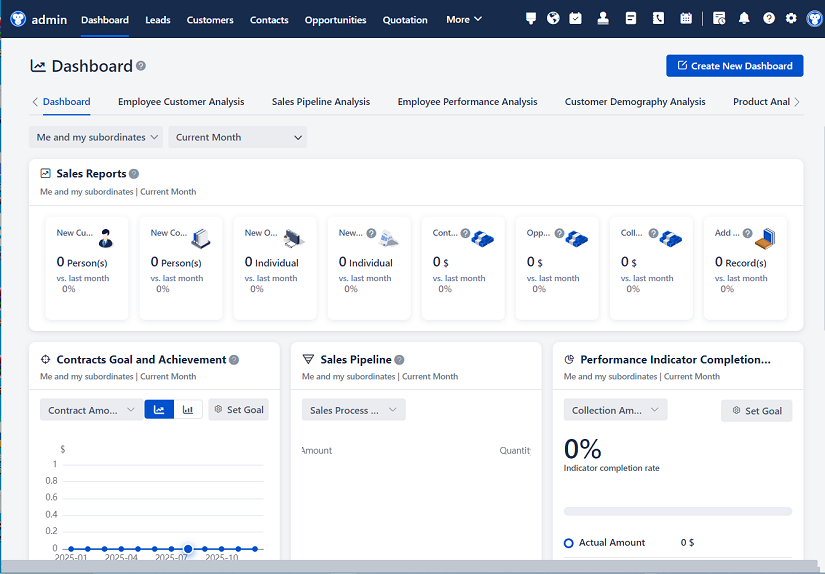
△Click on the top right corner to try Wukong CRM for free
Tips for Writing Effective CRM Reports
Customer Relationship Management (CRM) reports are more than just data dumps—they’re strategic tools that drive decision-making, improve customer experiences, and fuel business growth. Yet, too many teams treat them as routine administrative tasks, churning out dense spreadsheets or generic dashboards that fail to tell a compelling story. The truth is, an effective CRM report doesn’t just present numbers—it reveals insights, highlights opportunities, and guides action. Whether you’re a sales manager, marketing strategist, or customer success lead, mastering the art of CRM reporting can significantly amplify your impact. Here’s how to do it right.
Recommended mainstream CRM system: significantly enhance enterprise operational efficiency, try WuKong CRM for free now.
1. Start with a Clear Purpose
Before you even open your CRM system, ask yourself: Why am I creating this report? Is it to track quarterly sales performance? Identify at-risk customers? Measure campaign ROI? Without a defined objective, your report risks becoming a cluttered mess of irrelevant metrics.
Effective reports are built around specific questions. For example:
- “Which sales reps are underperforming against quota?”
- “What’s our customer churn rate by segment?”
- “How long does it take leads to move from MQL to SQL?”
Pinpointing the core question ensures every chart, table, and metric serves a purpose. It also helps you tailor the report to its audience—executives need high-level trends, while frontline teams require granular, actionable details.
2. Know Your Audience
A report for the CFO looks nothing like one for a customer support supervisor. Executives care about revenue impact, efficiency gains, and strategic alignment. Sales reps want to see their individual pipelines and conversion rates. Marketing teams need attribution data and campaign performance.
Tailor both content and format accordingly:
- Leadership: Focus on KPIs, YoY comparisons, and ROI. Use clean visuals—bar charts, trend lines—and keep commentary concise.
- Operational teams: Include drill-down capabilities, raw data exports, and clear calls to action (e.g., “Follow up with these 10 stalled deals”).
- Cross-functional stakeholders: Highlight interdependencies—like how marketing lead quality affects sales cycle length.
Remember: if your audience can’t grasp the key takeaway in under 30 seconds, you’ve lost them.
3. Choose the Right Metrics—Not Just the Available Ones
It’s tempting to report everything your CRM tracks, but relevance trumps volume. Avoid vanity metrics like “total number of contacts” unless they directly tie to business outcomes. Instead, prioritize metrics that reflect performance, behavior, or risk:
- Sales: Win rate, average deal size, sales cycle length, pipeline coverage
- Marketing: Lead-to-customer conversion rate, cost per acquisition, campaign influence
- Customer Success: Net Promoter Score (NPS), renewal rate, support ticket volume by issue type
Also, consider leading vs. lagging indicators. Revenue is a lagging indicator—it tells you what happened. Pipeline health or customer engagement scores are leading indicators—they hint at what’s coming. Blend both for a complete picture.
4. Keep It Visual—but Not Overdesigned
Humans process visuals 60,000 times faster than text. A well-designed chart can reveal patterns that rows of numbers hide. But don’t confuse “visual” with “flashy.” Cluttered infographics, 3D pie charts, or rainbow color schemes distract more than they inform.
Stick to best practices:
- Use bar charts for comparisons, line graphs for trends over time, and scatter plots for correlations.
- Limit colors to 3–4 per visual; use consistent palettes across reports.
- Label axes clearly and avoid jargon like “QoQ Δ%” without explanation.
- Place the most critical insight front and center—don’t make readers hunt for it.
Tools like Power BI, Tableau, or even native CRM dashboards (e.g., Salesforce Reports & Dashboards) offer clean templates. Resist the urge to over-customize.
5. Tell a Story with Context
Data alone rarely speaks for itself. Why did churn spike last month? Was it a product issue, pricing change, or competitor move? Your report should provide narrative context—not just “what,” but “why” and “so what.”
Structure your report like a story:
- Opening: State the key finding or trend (“Renewal rates dropped 12% in Q2”).
- Middle: Explain contributing factors (“Analysis shows 70% of non-renewals came from customers who logged >5 support tickets”).
- Close: Recommend actions (“Prioritize proactive check-ins with high-ticket customers; revise onboarding for new users”).
Use annotations directly on charts (“Churn peaked after Feature X launch”) or brief commentary boxes. This transforms passive data into active guidance.
6. Ensure Data Accuracy and Consistency
Nothing undermines credibility faster than inconsistent or incorrect data. If your sales team logs deals inconsistently—some using “Closed Won,” others “Won”—your win rate becomes meaningless. Garbage in, garbage out.
To maintain integrity:
- Standardize definitions: Agree on what “lead,” “opportunity,” or “active customer” means across teams.
- Audit regularly: Run spot checks to verify CRM entries match source systems (e.g., billing platforms).
- Document assumptions: Note if data excludes certain regions, channels, or timeframes.
- Automate where possible: Use CRM workflows to auto-populate fields (e.g., deal stage based on email activity) to reduce manual errors.
If stakeholders doubt your data, they’ll ignore your insights—even if they’re brilliant.
7. Make It Actionable
The ultimate test of a CRM report: Does it drive decisions? If the answer is “no,” it’s just noise. Every section should end with clear next steps. Instead of saying, “Support response time increased by 20%,” say, “Support response time increased by 20%—recommend hiring two additional agents or implementing chatbot triage by August.”
Actionability also means timeliness. A monthly report delivered two weeks late misses the window for intervention. Automate delivery schedules (e.g., “Sent every Monday at 9 a.m.”) and flag urgent issues in real time via alerts.
8. Iterate Based on Feedback
Great reporting isn’t static. After distributing a report, ask recipients:
- “Was this useful?”
- “What’s missing?”
- “What could be clearer?”
You might discover that your sales team actually needs weekly pipeline snapshots, not monthly summaries—or that finance wants to see CAC alongside LTV. Treat your first version as a draft, not a final product.
Also, revisit your reports quarterly. Business priorities shift; your metrics should too. That “social media engagement” metric might have mattered during a brand-awareness push, but now that you’re focused on retention, it’s irrelevant.
9. Leverage CRM Features—Don’t Fight Them
Most modern CRMs (HubSpot, Salesforce, Zoho, etc.) come packed with reporting tools you’re probably underusing. Instead of exporting data to Excel for manual manipulation, explore native capabilities:
- Filters and segments: Slice data by region, product line, or customer tier instantly.
- Custom formulas: Calculate derived metrics like “pipeline velocity” without external tools.
- Scheduled emails: Automate distribution so stakeholders get reports without chasing you.
- Interactive dashboards: Let users toggle between views (e.g., “Show me only Enterprise accounts”).
Learning these features saves hours and reduces errors. Plus, it keeps everyone working from the same source of truth.
10. Balance Depth with Simplicity
There’s a fine line between thorough and overwhelming. A 20-page report with 50 charts will be skimmed—or ignored. Aim for brevity without sacrificing substance.
Try the “one-page rule”: Can you summarize the core insight, supporting evidence, and recommended action on a single slide or page? If yes, put that upfront. Appendices or drill-down tabs can house deeper analysis for those who want it.
Use white space generously. Short paragraphs. Bullet points instead of dense blocks. Bold key figures. Your goal isn’t to impress with complexity—it’s to enable quick understanding and confident action.
Final Thoughts
Writing effective CRM reports isn’t about technical prowess—it’s about communication. You’re not just moving data from Point A to Point B; you’re translating raw information into business intelligence. The best reports feel less like documents and more like conversations: “Here’s what’s happening. Here’s why it matters. Here’s what we should do next.”
Start small. Pick one recurring report and apply these tips. Trim the fluff. Add context. Ask for feedback. Over time, you’ll shift from producing reports to driving results—and that’s when CRM truly earns its name.
After all, relationships aren’t managed by data alone. They’re nurtured through insight, empathy, and action. Your reports should do the same.
Relevant information:
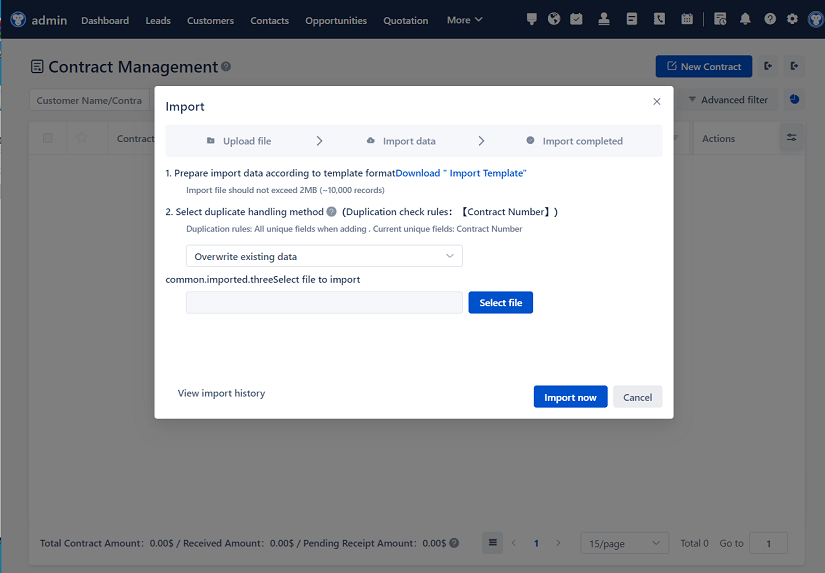
Significantly enhance your business operational efficiency. Try the Wukong CRM system for free now.
AI CRM system.