△Click on the top right corner to try Wukong CRM for free
Getting Started with CRM Data Analytics: Turning Customer Insights into Action
In today’s hyper-competitive business landscape, simply having a customer relationship management (CRM) system isn’t enough. Companies collect mountains of data—every email opened, every support ticket logged, every purchase made—but without the right approach to analyzing that information, it’s just digital clutter. The real power lies in CRM data analytics: the process of transforming raw customer data into meaningful insights that drive smarter decisions, stronger relationships, and sustainable growth.
Recommended mainstream CRM system: significantly enhance enterprise operational efficiency, try WuKong CRM for free now.
If you’re new to this space, don’t worry. You don’t need a team of data scientists or a six-figure software budget to get started. What you do need is clarity on what matters, a willingness to ask the right questions, and a practical roadmap for turning numbers into narratives your team can act on.
Why CRM Data Analytics Matters
At its core, CRM data analytics helps you understand who your customers are, how they behave, and what they truly value. It moves you from guessing to knowing. Instead of assuming which marketing campaign performed best, you can see exactly which channel drove the highest conversion rate. Rather than wondering why churn spiked last quarter, you can pinpoint patterns—maybe customers who didn’t engage with onboarding content were far more likely to cancel.
This isn’t just about efficiency; it’s about empathy. When you analyze customer interactions systematically, you uncover pain points, preferences, and opportunities to deliver more personalized, timely, and relevant experiences. And in an era where customers expect brands to “just get it,” that kind of insight is priceless.
Starting Simple: Define Your Goals First
Before diving into dashboards or SQL queries, take a step back. Ask yourself: What business outcomes do I want to improve? Common starting points include:
- Increasing customer retention
- Boosting sales conversion rates
- Reducing support response times
- Improving lead qualification accuracy
- Personalizing marketing messages
Your goals will dictate which data you need to focus on. For example, if reducing churn is your priority, you’ll want to track metrics like customer lifetime value (CLV), repeat purchase frequency, support ticket volume, and engagement with educational content. If you’re focused on sales performance, look at lead-to-opportunity conversion time, average deal size, and win/loss reasons.
The key is to avoid analysis paralysis. Don’t try to measure everything at once. Pick one or two high-impact areas and go deep.
Know Your Data Sources
Most modern CRMs—whether Salesforce, HubSpot, Zoho, or Microsoft Dynamics—capture a wealth of structured and semi-structured data. Typical sources include:
- Contact and account records (demographics, firmographics)
- Interaction history (emails, calls, meetings)
- Sales pipeline stages and deal progression
- Support tickets and resolution logs
- Marketing campaign responses (clicks, opens, form submissions)
- Product usage data (if integrated with product analytics tools)
But here’s the catch: data quality is everything. Garbage in, garbage out. If your sales reps inconsistently log calls or your marketing team uses vague campaign names, your analytics will be misleading. Before you build reports, clean up your data hygiene practices. Standardize fields, enforce required entries, and schedule regular audits.
Start with Basic Reports—Then Evolve
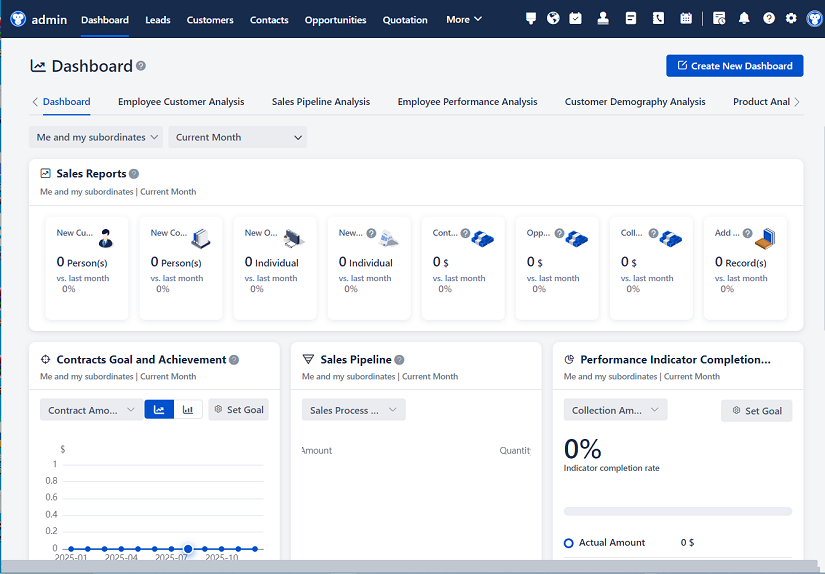
You don’t need advanced machine learning models on day one. Begin with descriptive analytics: what happened? Most CRMs come with built-in reporting tools that let you create simple visualizations without coding.
For instance:
- A funnel report showing how many leads move from “Marketing Qualified” to “Sales Accepted” to “Closed Won”
- A cohort analysis comparing retention rates of customers acquired in Q1 vs. Q2
- A dashboard tracking average response time by support agent
These reports answer foundational questions and often reveal quick wins. Maybe you notice that deals stall for two weeks in the “Proposal Sent” stage—that’s a signal to revisit your follow-up process.
As you grow more comfortable, layer in diagnostic analytics: why did it happen? This might involve segmenting your data. For example, instead of looking at overall churn, break it down by customer size, industry, or onboarding completion status. You might discover that small businesses with fewer than five employees churn at twice the rate of mid-market clients—a clue that your product may not be well-suited for very small teams, or that your onboarding isn’t tailored to their needs.
From there, you can explore predictive and prescriptive analytics, but only if it aligns with your goals. Predictive models (like forecasting next-quarter revenue or identifying at-risk accounts) require cleaner data and more sophisticated tools, but even basic trend analysis can be surprisingly powerful.
Leverage Native Tools—and Know When to Go Beyond
Many teams underestimate what their existing CRM can do. Salesforce has Einstein Analytics, HubSpot offers custom reporting dashboards, and Zoho provides robust analytics modules. Start there. Build reports, share them with stakeholders, and iterate based on feedback.
However, as your needs grow, you may hit limitations. Native tools often struggle with cross-system analysis. What if you want to combine CRM data with website behavior from Google Analytics or billing data from Stripe? That’s when you consider integrating your CRM with a business intelligence (BI) platform like Tableau, Power BI, or Looker Studio.
The integration doesn’t have to be complex. Many CRMs offer native connectors or work seamlessly with middleware like Zapier or Segment. The goal is to create a single source of truth where customer data from multiple touchpoints lives together, enabling richer insights.
Focus on Actionable Metrics, Not Vanity Numbers
It’s easy to get seduced by big numbers: “We have 50,000 contacts!” or “Our open rate is 40%!” But vanity metrics rarely drive action. Instead, prioritize metrics tied directly to business outcomes.
Consider these examples:
- Customer Health Score: A composite metric combining usage frequency, support interactions, and payment history to flag at-risk accounts before they churn.
- Lead Response Time: How quickly your team follows up with a new lead. Studies show that contacting a lead within five minutes increases conversion odds by 900%.
- Sales Cycle Length: Tracking how long deals take to close helps identify bottlenecks and forecast revenue more accurately.
- Net Promoter Score (NPS) Trends: Correlating NPS with CRM activity (e.g., number of support tickets resolved) can reveal what truly drives loyalty.
The best metrics are those that prompt a clear next step. If your lead response time is over 24 hours, the action is obvious: streamline your intake process or assign dedicated responders.
Build a Culture of Data Literacy
Tools and dashboards are useless if your team doesn’t understand—or trust—the data. Invest time in training. Show sales reps how pipeline reports help them prioritize. Teach marketers how to interpret campaign attribution. Help support agents see how their resolution times impact overall customer satisfaction.
Encourage curiosity. Create a Slack channel where team members share surprising findings (“Did you know customers who attend our webinars have 3x higher renewal rates?”). Celebrate wins driven by data, not gut feeling.
And crucially, make data accessible. No one should need to file a ticket to get a basic report. Empower frontline employees with self-service dashboards so they can answer their own questions in real time.
Avoid Common Pitfalls
Even seasoned teams stumble. Here are a few traps to watch for:
1. Confusing correlation with causation. Just because two metrics move together doesn’t mean one causes the other. Maybe high email open rates coincide with low churn—but that doesn’t prove emails prevent cancellations. Dig deeper.
2. Ignoring data context. A 20% drop in demo requests sounds alarming—until you realize it followed a pricing page redesign that filtered out unqualified visitors. Always pair numbers with qualitative insights (customer interviews, win/loss calls).
3. Overcomplicating visualizations. A cluttered dashboard with ten overlapping charts confuses more than it clarifies. Stick to simple bar graphs, line charts, and tables. Less is more.
4. Setting and forgetting. Analytics isn’t a one-time project. Markets shift, customer behaviors evolve, and new data sources emerge. Schedule monthly reviews to refine your metrics and hypotheses.
Real-World Example: From Reactive to Proactive
Let’s say you run a SaaS company with rising churn. Using CRM data analytics, you start by segmenting customers by usage patterns. You notice that users who log in fewer than three times in their first 30 days are five times more likely to cancel by month three.
Armed with this insight, you create an automated workflow: if a new customer hasn’t hit the three-login threshold by day 10, they receive a personalized email with a short tutorial video and an invitation to a live onboarding session. You also alert their account manager to make a check-in call.
Three months later, you compare cohorts. The intervention group shows a 25% reduction in early churn. That’s not just a win—it’s a scalable playbook for customer success.
The Bottom Line
CRM data analytics isn’t about fancy algorithms or real-time AI predictions (at least not at first). It’s about asking better questions, listening to what your customers’ behavior tells you, and acting with intention. Start small, stay focused on outcomes, and remember: the goal isn’t more data—it’s better decisions.
Your CRM holds a story about your customers. With the right approach to analytics, you won’t just read that story—you’ll help write the next chapter.
Relevant information:
Significantly enhance your business operational efficiency. Try the Wukong CRM system for free now.
AI CRM system.