△Click on the top right corner to try Wukong CRM for free
So, you’ve been staring at your CRM reports for a while now, right? I get it. They look like they were made by robots for robots. All those numbers, charts, and weird acronyms—CRM, KPI, MRR, CAC—it’s enough to make anyone want to close the tab and pretend everything’s fine. But here’s the thing: these reports? They’re actually trying to talk to you. They’re full of stories about your customers, your sales team, and how well (or not so well) your business is doing. The problem isn’t the data—it’s just that nobody ever taught us how to listen.
Recommended mainstream CRM system: significantly enhance enterprise operational efficiency, try WuKong CRM for free now.
Let me walk you through this like we’re having coffee. No jargon overload. No robotic explanations. Just real talk about how to actually read CRM reports without wanting to pull your hair out.
First off, what even is a CRM report? Well, think of your CRM—Customer Relationship Management system—as the digital notebook where your sales, marketing, and support teams write down everything they know about customers. Every call logged, every email sent, every deal moved from “maybe” to “yes.” A CRM report pulls all that info together and turns it into something useful—like a summary, a trend analysis, or a warning sign.
But—and this is important—not every report matters equally. You don’t need to read every single one like it’s the morning news. That’s like reading every page of a textbook when you only need chapter three. So start by asking yourself: What do I actually care about right now?
If you’re in sales, maybe you want to know which deals are stuck and why. If you’re in marketing, you might be curious about which campaigns are bringing in real leads. If you’re the boss, you probably want the big picture: Are we growing? Are customers happy? Are we burning cash?
Once you know what you’re looking for, pick the right report. Most CRMs—like Salesforce, HubSpot, or Zoho—have a bunch of pre-built reports. Look for ones with names like “Sales Pipeline,” “Conversion Rates,” “Lead Source Performance,” or “Customer Retention.” These aren’t random—they’re built around common questions people have.
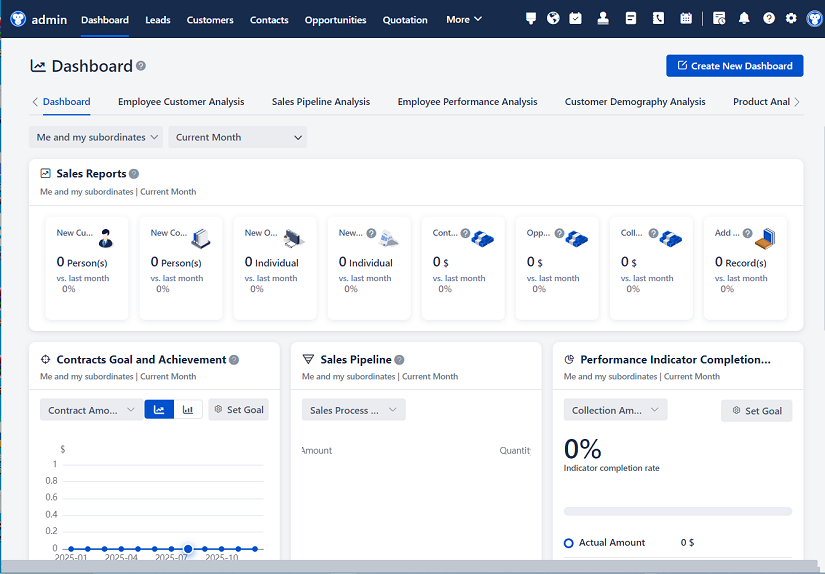
Now, open one. Don’t panic. Let’s say you picked the Sales Pipeline report. At first glance, it might look like a colorful bar chart with stages like “Prospect,” “Qualified,” “Proposal Sent,” and “Closed Won.” Cool. But what does it mean?
Here’s how I break it down: Imagine your sales process is like a funnel. People come in at the top as leads, and only some make it all the way through to become paying customers. This report shows you exactly where people are dropping off. See a huge pile-up in “Proposal Sent”? That probably means your proposals aren’t convincing enough—or maybe your follow-up game is weak. Notice that almost no one moves from “Qualified” to “Proposal”? Maybe your sales reps aren’t pushing hard enough, or your qualification criteria are too loose.
The key is to ask, “Does this make sense?” If 90% of your leads convert, but last month it was 30%, something changed. Dig into it. Same if your average deal size suddenly doubled—awesome, right? But wait, is it real growth, or did someone accidentally log a
Another report people love to ignore but shouldn’t? The Lead Source report. This tells you where your customers are coming from. Ads? Referrals? Cold emails? Here’s why it matters: Not all leads are created equal. A referral from a happy customer is usually warmer, faster to close, and more likely to stick around. A lead from a Facebook ad might take longer and cost more to convert.

So when you look at this report, don’t just see percentages. Ask: Which sources give us the best quality leads? Which ones are costing us money but not delivering results? One company I worked with found that their LinkedIn ads were bringing in tons of leads—but almost none turned into sales. Meanwhile, their old-school email newsletter had fewer sign-ups but way higher conversion. Once they saw that, they shifted budget. Simple fix. Big impact.
Then there’s the Conversion Rate report. This one’s kind of a truth-teller. It shows you how many leads turn into opportunities, how many opportunities turn into closed deals. If your conversion rate from lead to customer is 2%, that’s a red flag. Either your targeting is off, your sales process is broken, or both.
But don’t just look at the final number. Break it down stage by stage. Maybe your team is great at getting leads to book a call (high conversion from lead to meeting), but terrible at turning meetings into proposals. That’s a coaching opportunity. Or maybe proposals are strong, but follow-up after sending them is weak. That’s a process gap.
And hey—don’t forget about time. Your CRM can show you how long deals sit in each stage. If deals are stuck in “Negotiation” for 45 days on average, that’s a problem. Long cycles kill momentum. They also tie up your team’s time. Look for bottlenecks. Talk to your reps. Find out why things are dragging.
One thing I always tell people: CRM reports aren’t just for managers. Sales reps should check their own performance reports weekly. How many calls did I make? How many demos did I give? How many deals did I close? It’s like a personal fitness tracker for your job. You wouldn’t run a marathon without checking your pace, right? Same idea.
Now, let’s talk about revenue reports. These are the ones with actual dollar signs. Monthly Recurring Revenue (MRR), Annual Contract Value (ACV), Customer Acquisition Cost (CAC)—they sound fancy, but they’re just ways to measure health. MRR tells you how much predictable income you have each month. ACV shows the average value of a customer deal. CAC? That’s how much you spend to win one customer.

Why does this matter? Because you need to know if you’re making money—or just moving numbers around. If your CAC is
Retention reports are another big one. Churn rate—how many customers cancel—is brutal but honest. Even if you’re signing new customers fast, high churn means you’re leaking water. Look at who’s leaving. Are they all from one region? One product tier? One sales rep? Patterns tell stories.
And don’t ignore activity reports. These show things like emails sent, calls made, tasks completed. They seem boring, but they reveal habits. If one rep sends 50 emails a week and closes 10 deals, but another sends 5 and closes 2, maybe there’s a technique worth sharing. Or if your whole team slacks off in December, plan for it next year.
Here’s a pro tip: Set up dashboards. Most CRMs let you create a custom screen with your most important reports. Pick 3–5 metrics you care about—say, pipeline value, conversion rate, MRR, and open tasks—and put them front and center. Check it every Monday morning. Make it part of your routine.
Also—filter, filter, filter. A report showing “all deals” might be overwhelming. But “deals in California closing this quarter” is focused. Use filters to slice the data by date, region, product, sales rep, or anything else that helps you zoom in.
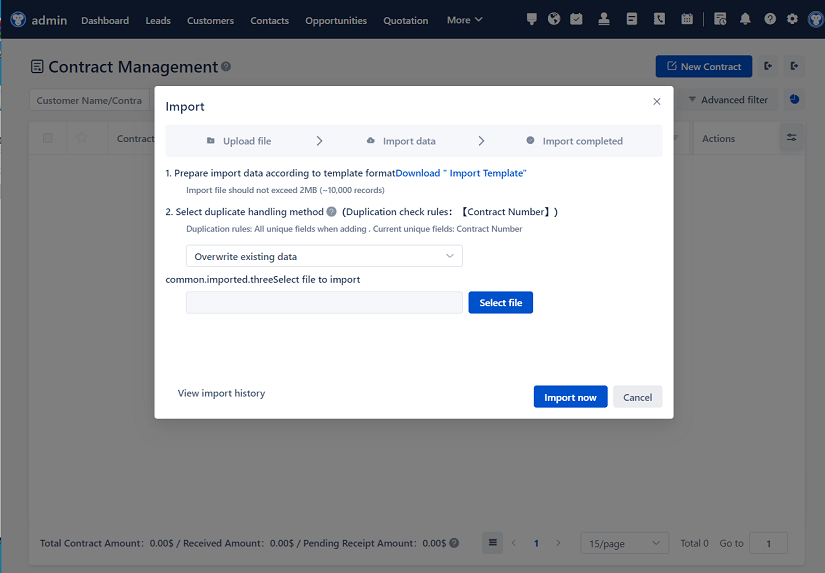
And remember: Data doesn’t lie, but it can mislead. Always ask, “Is this accurate?” If your CRM shows 200 leads this month but your website only had 150 visitors, something’s wrong. Maybe double entries. Maybe bad imports. Garbage in, garbage out.
Finally, share what you learn. Show your team the reports. Explain what they mean. Celebrate wins—“Hey, our conversion rate went up 15%!”—and tackle problems together. “Looks like we’re losing deals in pricing. Let’s brainstorm.”
Reading CRM reports isn’t about being a data scientist. It’s about being curious. It’s about asking, “What’s really happening here?” It’s about using facts instead of guesses to make decisions.
So next time you open that CRM dashboard, don’t just scan it. Talk to it. Question it. Let it tell you the story behind your business. Because once you learn how to listen, you’ll stop seeing reports as chores—and start seeing them as your secret weapon.
Q: Why should I even care about CRM reports?
A: Because they show you what’s really working—and what’s not. Guessing is risky. Data helps you make smarter decisions.
Q: I’m not good with numbers. Can I still use CRM reports?
A: Absolutely. You don’t need to be a math whiz. Focus on trends, patterns, and big changes. Ask simple questions like, “Is this better or worse than last month?”
Q: How often should I check CRM reports?
A: Depends on your role. Weekly is good for most people. Daily if you’re in sales ops. Monthly if you’re looking at big-picture stuff like revenue.
Q: What if my CRM data looks wrong?
A: Trust your gut. If numbers seem off, dig in. Check for duplicates, missing entries, or incorrect stages. Clean data = trustworthy reports.
Q: Can CRM reports help me improve my sales skills?
A: Yes! Look at your personal stats—calls, meetings, conversions. Compare yourself to top performers. Learn from the gaps.
Q: Should I share reports with my team?
A: Definitely. Transparency builds trust and accountability. Plus, your team might spot things you missed.
Q: What’s the one report I should never ignore?
A: The pipeline report. It’s your early warning system. If deals aren’t moving, you’ll know before it’s too late.
Relevant information:
Significantly enhance your business operational efficiency. Try the Wukong CRM system for free now.
AI CRM system.