△Click on the top right corner to try Wukong CRM for free
So, you know how sometimes you're trying to make sense of your customer data, and it just feels like you're drowning in spreadsheets and half-finished reports? Yeah, I’ve been there too. It’s overwhelming. You’ve got sales numbers here, support tickets there, email open rates somewhere else — all floating around with no real structure. That’s exactly why having a solid template for CRM analysis reports is such a game-changer.
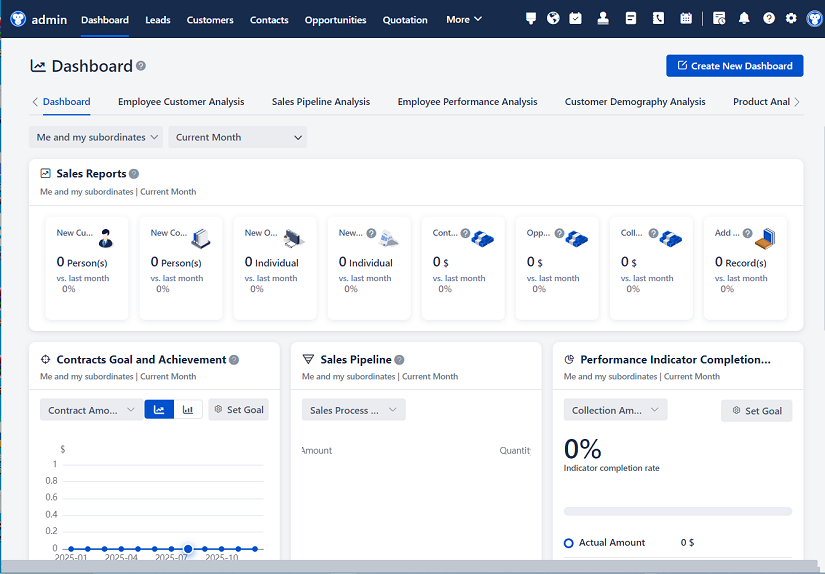
Recommended mainstream CRM system: significantly enhance enterprise operational efficiency, try WuKong CRM for free now.
Let me tell you, once we started using a consistent template, everything just clicked. Suddenly, our team wasn’t guessing what the numbers meant or arguing over which metric mattered most. We had a shared language, a clear format that everyone could follow. And honestly, it saved us so much time.
Now, I’m not saying you need some super complicated system. In fact, the best templates are actually pretty simple. They guide you through the key points without making you feel like you’re writing a thesis. Think of it like a recipe — you don’t have to be a chef to make a great meal if you’ve got good instructions.
So what should go into this template? Well, first things first — you need a clear title. Sounds obvious, right? But seriously, I can’t count how many times I’ve opened a report and had no idea what it was about. A good title tells people exactly what they’re looking at: “Q3 Customer Retention Analysis – North Region,” for example. That way, even if someone only skims it, they get the gist.
Next up, an executive summary. Now, I know some people skip this part, but trust me, it’s worth it. Most of the folks reading your report are busy. They don’t have time to dig through every chart. So give them the highlights upfront. What’s the big takeaway? Did retention go up? Down? Why? Just a few sentences can make all the difference.
Then comes the context section. This is where you set the stage. What were we analyzing? Over what time period? Any major events that might’ve influenced the results — like a product launch or a marketing campaign? Including this helps people understand why the numbers look the way they do. Otherwise, someone might see a dip in engagement and panic, when really, it’s because you paused email campaigns for two weeks.
After that, dive into the actual data. But don’t just dump raw numbers on the page. Nobody wants to stare at a table full of decimals. Use charts — bar graphs, line charts, pie charts if it makes sense. Visuals help people spot trends fast. And always label your axes! I can’t tell you how many times I’ve seen a graph with no units or unclear labels. It drives me nuts.
One thing I’ve learned the hard way: define your metrics. Not everyone on your team might know what “churn rate” or “average deal size” means. So include a quick definitions section. It doesn’t have to be long — just a sentence or two per term. Better safe than sorry.
Now, here’s the part where you really add value: interpretation. Don’t just say “sales increased by 12%.” Tell me why that matters. Was that expected? Better than last quarter? How does it compare to industry benchmarks? This is where your analysis turns from data reporting into real insight.
And hey, don’t ignore the outliers. Sometimes the most interesting stuff happens in the edges. Maybe one sales rep crushed their targets while everyone else stayed flat. Or maybe customers in a certain region are way more engaged. Dig into that. Those details often lead to the best action items.

Speaking of action items — you gotta include them. What should the team do with this information? Should marketing tweak their messaging? Should sales reach out to inactive accounts? Be specific. Vague suggestions like “improve customer experience” aren’t helpful. Say something like, “Follow up with customers who haven’t logged in for 30 days using the new re-engagement email sequence.”
I also like to include a “limitations” section. No report is perfect, and being honest about what the data doesn’t show builds trust. Maybe your CRM didn’t track phone calls well during the month, or maybe a bug affected lead scoring. Acknowledge it. People appreciate transparency.
Another tip: keep your tone professional but conversational. You’re not writing a legal document. Use plain English. Say “we saw a drop in sign-ups” instead of “a reduction in conversion volume was observed.” The first one is clearer and easier to understand.
And please, for the love of clarity, use headings and subheadings. Break up the text so it’s easy to scan. If someone’s in a hurry, they should be able to jump to the section they care about — like “Customer Satisfaction Trends” or “Top Performing Campaigns.”
Formatting matters too. Pick a clean font, use consistent colors, and leave enough white space. A cluttered report is exhausting to read. Make it look inviting, like something people want to open, not dread.
One thing we started doing recently is adding a “key takeaways” box at the end. Just three or four bullet points summarizing the most important findings. It’s like a cheat sheet for busy leaders. Super useful.

Oh, and version control! If you’re updating the report regularly, make sure each version is clearly labeled. Nothing worse than someone acting on last month’s data because they grabbed the wrong file.
Now, about frequency — how often should you run these reports? That depends on your business. Some teams do weekly check-ins, others monthly or quarterly. Find a rhythm that works. But whatever you do, stick to it. Consistency helps you spot trends over time.
And don’t forget to share the report with the right people. Sales managers, marketing leads, customer support supervisors — they all need different pieces of the puzzle. Customize what you send if needed, but keep the core template the same so everyone’s aligned.
Here’s a pro tip: get feedback on your template. Ask your colleagues, “Hey, is this report helpful? What would make it better?” You’d be surprised how much you can improve it based on real user input.
Also, automate where you can. If your CRM pulls data into dashboards or exports to Excel automatically, use that. Manual data entry is a time-suck and prone to errors. Let the machines do the heavy lifting.
But remember — automation doesn’t replace thinking. You still need to interpret the numbers. A robot can tell you that churn went up, but only a human can figure out why — maybe it’s pricing, onboarding, or a competitor’s new feature.
Another thing: celebrate wins. If a strategy worked, say so! Highlight success stories. It boosts morale and shows what good looks like. Plus, it helps you replicate those wins in other areas.
And when things go wrong? Own it. Don’t hide bad news. Instead, frame it as a learning opportunity. “We expected higher engagement from Campaign X, but results were below average. Here’s what we think went wrong, and here’s how we’ll adjust.”
You’d be amazed how much trust that builds across teams. People respect honesty and accountability.
Now, let’s talk about customization. Your template shouldn’t be one-size-fits-all. You might have different versions for sales performance, customer support, or marketing ROI. But keep the core structure similar — title, summary, context, data, insights, actions — so it feels familiar no matter what.
And visuals? Yeah, they’re not just fluff. A well-designed chart can communicate in seconds what paragraphs of text would take minutes to explain. But don’t go overboard. One powerful graph is better than five confusing ones.
Use color wisely. Green for positive trends, red for warnings — but be mindful of colorblind users. Maybe use patterns or labels too. Accessibility matters.
Also, keep mobile in mind. Some people might read your report on a phone or tablet. Make sure tables aren’t too wide and text is readable without zooming.
One last thing — archive your old reports. You never know when you’ll need to look back at Q2 from two years ago to spot a seasonal trend. Store them in a shared drive with clear naming conventions.
Honestly, once you get your template dialed in, reporting becomes less of a chore and more of a tool. It stops being about checking a box and starts driving real decisions.
And that’s the whole point, right? Data isn’t valuable just because you have it — it’s valuable when it leads to action.
So if you’re still winging your CRM reports, I really encourage you to try a structured template. Start simple. Tweak it over time. Get your team involved. You’ll be amazed at how much clearer your insights become.
It’s not about perfection. It’s about progress. Even a basic template is better than nothing.
And hey, if you ever feel stuck, just ask yourself: “What would I want to know if I were the person reading this?” That usually points you in the right direction.
Alright, I’ve probably said enough. But seriously — give it a shot. Your future self (and your teammates) will thank you.
Q: Why do I need a template for CRM reports?
A: Because without one, every report looks different, takes longer to create, and confuses your team. A template keeps things consistent, saves time, and makes your insights easier to understand.
Q: Can I customize the template for different departments?
A: Absolutely. You can have variations for sales, marketing, and support — just keep the core structure the same so everyone stays aligned.
Q: How often should I update the CRM analysis report?
A: It depends on your needs. Weekly for fast-moving teams, monthly for most businesses, or quarterly for strategic reviews. Pick a rhythm and stick to it.
Q: What if my CRM data is incomplete or messy?
A: Acknowledge it in the report. Include a “data limitations” section. It’s better to be honest than to pretend flawed data tells the full story.
Q: Should I include recommendations in every report?
A: Yes. Reports shouldn’t just describe what happened — they should guide what to do next. Actionable insights are what turn data into results.
Q: How do I make my reports more engaging?
A: Use clear visuals, plain language, and real examples. Avoid jargon. Focus on storytelling — what changed, why it matters, and what we should do.
Q: Who should receive the CRM analysis report?
A: Anyone who makes decisions based on customer data — sales managers, marketing leads, customer success teams, and executives. Tailor the depth to the audience.
Q: Can I automate parts of the report?
A: Definitely. Use CRM dashboards, scheduled exports, or BI tools to auto-generate charts and tables. Just remember to add your human analysis on top.
Q: What’s the biggest mistake people make with CRM reports?
A: Just dumping data without interpretation. Numbers alone don’t tell the full story. Always explain what the data means and why it matters.

Q: How long should a CRM analysis report be?
A: As long as it needs to be — but aim for clarity over length. Most effective reports are 2–5 pages, with a strong summary and clear visuals.
Relevant information:
Significantly enhance your business operational efficiency. Try the Wukong CRM system for free now.
AI CRM system.