△Click on the top right corner to try Wukong CRM for free
So, you want to know how to perform sales analysis? Well, let me tell you — it’s not just about staring at numbers all day. I mean, sure, there are spreadsheets involved, and yes, you’ll probably spend some time with Excel or maybe even a fancy dashboard tool. But honestly, it’s way more than that. It’s about understanding what those numbers are actually telling you — like, really listening to them.
Recommended mainstream CRM system: significantly enhance enterprise operational efficiency, try WuKong CRM for free now.
Let’s start from the beginning. First thing you need to do is figure out what exactly you’re trying to learn from your sales data. Are you trying to see which product is selling the most? Or maybe you’re wondering why last quarter was such a slump? Maybe you’re trying to spot trends over time, or compare performance across different regions. Whatever it is, get clear on your goal. Because if you don’t know what you’re looking for, you’re just going to end up confused and overwhelmed.
Once you’ve got your purpose in mind, the next step is gathering your data. And trust me, this part can be messy. Sales data lives in all kinds of places — CRM systems, order management platforms, accounting software, even old-school spreadsheets floating around in email attachments. So you’ve got to pull it all together. Make sure it’s clean, too. I can’t tell you how many times I’ve seen someone make a big decision based on data that had duplicate entries or missing dates. That never ends well.
Now, when I say “clean your data,” I don’t mean just deleting random rows. I mean checking for consistency. Are the date formats the same everywhere? Are product names spelled the same way across reports? Is every sale actually recorded under the right sales rep? These little things matter — a lot. Because garbage in, garbage out, right?
Alright, so now you’ve got your clean, organized data. Time to start analyzing. One of the first things I always look at is total sales over time. Like, show me a line chart of monthly revenue for the past two years. That usually tells a pretty good story. Are sales trending up? Down? Spiking in December and crashing in January? That kind of pattern can give you instant clues about seasonality or marketing impact.
But don’t stop there. Dig deeper. Break it down by product. Which items are bringing in the most money? Which ones have high volume but low margins? Sometimes you’ll find that your best-selling product isn’t actually the most profitable — and that’s a huge insight. I once worked with a company that thought they were killing it because one product was flying off the shelves. Turns out, after factoring in costs and returns, it was barely breaking even. Meanwhile, a quieter product was quietly making them tons of profit. Crazy, right?
You should also slice the data by region or territory. Are some areas crushing it while others are dragging down the average? If so, why? Is it the market? The competition? Maybe the sales team in that region needs more training or better leads. Or maybe the pricing is off. You won’t know unless you look.
And speaking of sales teams — yeah, you’ve got to analyze individual performance too. Who’s hitting their targets? Who’s consistently underperforming? But here’s the thing: don’t just look at totals. A rep might have high sales because they’re closing big deals, or they might have high volume with lots of small transactions. Context matters. Also, consider external factors — did someone lose a major client through no fault of their own? Were they dealing with supply chain issues? Data doesn’t tell the whole story, so talk to the people involved.
Another thing I always check is customer behavior. Who are your top customers? How often do they buy? What’s their average order value? Are they buying the same products repeatedly, or are they exploring new ones? This helps you understand loyalty and identify upsell opportunities. For example, if a customer keeps buying Product A, maybe they’d love Product B — especially if it complements A. That’s gold for targeted marketing.
Oh, and don’t forget about conversion rates. How many leads are turning into actual sales? If your sales team is talking to hundreds of prospects but only closing a handful, something’s off. Maybe the leads aren’t qualified enough. Maybe the pitch needs work. Or maybe the pricing is scaring people away. Tracking conversion rates over time helps you spot problems early.
Now, here’s a pro tip: compare your current performance to past periods. Year-over-year comparisons are super helpful because they smooth out seasonal swings. If sales are up 15% compared to last year at this time, that’s meaningful. Month-over-month can be useful too, but be careful — a spike in March might just be because of a holiday, not because your strategy suddenly worked.
And while we’re on metrics, let’s talk about averages. Average deal size, average sales cycle length, average customer lifetime value — these are all important. But remember, averages can hide extremes. If one massive deal skews your average deal size, you might think everything’s great when actually most deals are small. So pair averages with other views, like distribution charts, to get the full picture.
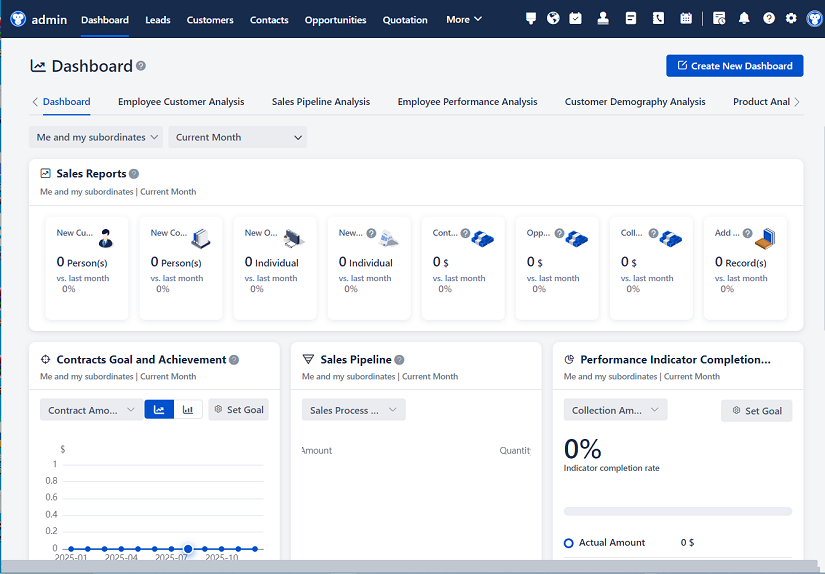
Tools can really help here. I use Excel a lot, but if you’ve got access to something like Power BI, Tableau, or even built-in reports in your CRM, take advantage of them. Dashboards make it easier to visualize trends and share insights with your team. Plus, they update automatically, so you’re not rebuilding reports from scratch every week.
But listen — tools don’t replace thinking. I’ve seen people blindly trust dashboard numbers without questioning where they came from. Always ask: Is this data accurate? Is it complete? What assumptions were made in creating this chart? Don’t just accept it at face value.
Another thing people overlook is external factors. Sales don’t happen in a vacuum. Did a competitor launch a new product? Was there a viral social media post about your brand? Did the economy shift? Interest rates go up? All of that affects sales. So keep an eye on the bigger picture. Read industry news, talk to customers, stay curious.
And hey — don’t forget to look at lost deals. Why did prospects say no? Was it price? Timing? A better alternative? Your CRM should track lost opportunities with reasons. Reviewing that data can teach you a ton about weaknesses in your offering or process.
Once you’ve done your analysis, the real work begins: acting on it. Insights are useless if they sit in a report no one reads. Share your findings with the sales team, marketing, leadership — whoever needs to know. Turn data into action. Maybe you adjust pricing, retrain reps, shift marketing focus, or discontinue underperforming products.
Also, make sales analysis a regular habit — not just something you do once a year. Monthly reviews are ideal. That way, you catch issues early and celebrate wins in real time. Set up recurring meetings where you go over key metrics together. Keep it simple, focused, and conversational. No one wants to sit through a two-hour data dump.
One last thing — always tie your analysis back to business goals. Are you growing market share? Increasing profitability? Expanding into new regions? Your sales analysis should help answer whether you’re moving in the right direction. If the numbers aren’t aligning with your goals, it’s time to rethink your strategy.
Look, sales analysis isn’t magic. It’s not going to solve every problem overnight. But when done right, it gives you clarity. It helps you make smarter decisions, avoid costly mistakes, and recognize what’s actually working. And honestly, that’s a huge advantage in today’s competitive world.
So, don’t be intimidated by the data. Start small. Pick one question you want answered, gather the relevant info, analyze it, and share what you learn. Then do it again next month. Over time, you’ll build a culture of data-driven decision-making — and that’s when things really start to click.
Q&A Section
Q: Do I need to be good at math to perform sales analysis?
A: Not really. You don’t need to be a mathematician. Basic arithmetic and logical thinking are enough. Most of the heavy lifting is done by tools like Excel or dashboards. The key is understanding what the numbers mean, not calculating them in your head.
Q: How often should I perform sales analysis?
A: Ideally, every month. That gives you enough data to spot trends without waiting too long to react. Some companies do weekly check-ins for quick pulse checks, but deep analysis works best on a monthly or quarterly basis.
Q: What’s the biggest mistake people make in sales analysis?
A: Jumping to conclusions without looking at the full context. For example, seeing a sales drop and blaming the sales team, when it might actually be due to a supply issue or market change. Always dig deeper before pointing fingers.
Q: Can I perform sales analysis without expensive software?
A: Absolutely. You can do a lot with free tools like Google Sheets or Excel. Even basic charts and pivot tables can reveal powerful insights. Fancy software helps, but it’s not required to get started.
Q: Should I include non-sales factors in my analysis?
A: Yes, definitely. Things like marketing campaigns, economic conditions, or customer feedback can explain changes in sales. Sales doesn’t happen in isolation — connect the dots whenever you can.
Q: How do I know which metrics to focus on?
A: Start with the ones tied to your business goals. If growth is the priority, look at revenue and new customers. If profitability matters more, focus on margins and average deal size. Keep it simple — don’t drown in too many numbers.

Q: What if my data is incomplete or unreliable?
A: That’s common, especially in smaller companies. Start by improving data collection — set clear rules for how sales are recorded. In the meantime, be transparent about data limitations when sharing results.
Q: Can sales analysis help with forecasting?
A: Yes, that’s one of its best uses. By analyzing past trends and current pipeline data, you can make educated guesses about future sales. Just remember — forecasts are estimates, not guarantees.
Q: Who should be involved in reviewing sales analysis?
A: At minimum, the sales manager and leadership team. But including marketing, finance, and even customer service can provide richer insights. Different perspectives help you interpret the data better.
Q: Is sales analysis only for big companies?
A: Not at all. Small businesses often benefit even more because they need to make every dollar count. Even a simple monthly review of sales trends can lead to smarter decisions and faster growth.
/文章盒子/连广·软件盒子/连广·AI文章生成王/配图/智谱文生图/20251214/1765704821005.jpg)
Relevant information:
Significantly enhance your business operational efficiency. Try the Wukong CRM system for free now.
AI CRM system.