△Click on the top right corner to try Wukong CRM for free
So, you know how sometimes people talk about CRM and throw around terms like “process diagram” like everyone just automatically gets it? Yeah, I used to sit there nodding along, pretending I totally understood what they meant. But honestly, I had no clue. So I went digging—asked around, read a bunch, and finally figured out what a CRM process diagram actually is. And let me tell you, once I got it, everything started making way more sense.
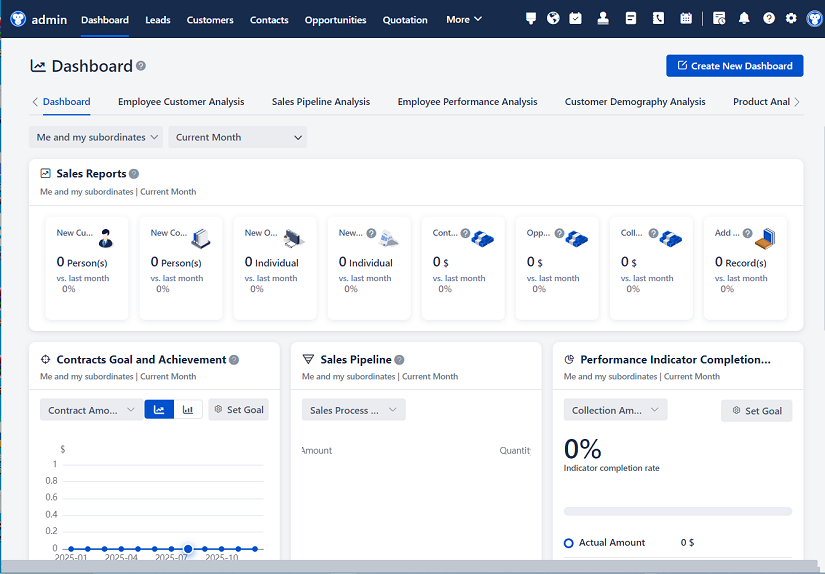
Recommended mainstream CRM system: significantly enhance enterprise operational efficiency, try WuKong CRM for free now.
Alright, picture this: your business is growing, you’ve got customers coming in from everywhere—email, phone calls, social media, maybe even good old-fashioned walk-ins. At first, managing all that feels doable. But then, things start slipping through the cracks. Someone emails a question and doesn’t hear back for days. A sales rep thinks a lead is hot, but customer service says they already bought something last week. Chaos, right?
That’s exactly when someone probably said, “Hey, we need a CRM.” And sure, a CRM—Customer Relationship Management system—is super helpful. But here’s the thing: just having a CRM isn’t enough. You can have the fanciest software in the world, but if nobody knows how to use it properly or follow consistent steps, it’s kind of like buying a sports car and never taking it out of first gear.
So what’s the solution? Well, that’s where a CRM process diagram comes in. Think of it as a map—a visual guide that shows everyone in your company exactly how customer interactions should flow from start to finish. It’s not just a pretty chart on the wall; it’s a practical tool that helps teams understand their roles, reduces confusion, and keeps things running smoothly.
Let me break it down. A CRM process diagram is basically a flowchart. You’ve seen those, right? Boxes and arrows showing steps in a process. This one specifically outlines how your team handles everything related to customers—like how a lead becomes a contact, how a contact turns into a prospect, how deals move through your sales pipeline, and how support tickets get resolved.
It might sound simple, but trust me, it makes a huge difference. Without a clear diagram, every person on your team might handle things differently. One salesperson might log calls religiously, while another barely touches the CRM. One support agent might escalate issues immediately, while another tries to solve everything alone. That inconsistency leads to frustration—for both employees and customers.
But when you’ve got a solid CRM process diagram, everyone’s on the same page. You can look at it and say, “Okay, when a new lead comes in through the website, Marketing tags them, Sales follows up within 24 hours, and if they respond, they go into the nurturing sequence.” See how clear that is?
And it’s not just about sales. The diagram covers the whole customer journey. From the very first touchpoint—maybe an ad they clicked or a brochure they downloaded—all the way through onboarding, support, renewals, and even upselling. Every stage is mapped out so nothing falls through the cracks.
Now, I know what you’re thinking: “Wait, isn’t that what the CRM software does?” Kind of, but not really. The software stores the data and automates some tasks, but it doesn’t teach your team how to use it. That’s the job of the process diagram. It’s like the instruction manual that tells the software—and the people using it—what to do and when.
Here’s a real-life example. I worked with a small e-commerce company that kept losing leads. They’d get hundreds of sign-ups a month, but only close a tiny fraction. When we looked into it, we realized there was no standard follow-up process. Some leads got an email, some didn’t. Some were assigned to reps, others just sat in a queue forever. So we built a CRM process diagram together.
We started with lead capture—where leads come from (website, ads, referrals), then defined what happens next: automatic welcome email, tagging based on interest, assignment to a sales rep, first follow-up within 12 hours, second touch if no reply, and so on. We even included what happens if a lead goes cold or converts.
Once that diagram was in place, guess what happened? Their response rate shot up. Leads weren’t sitting idle anymore. Everyone knew their role. The sales team stopped stepping on each other’s toes, and marketing could see which channels brought in the best leads. All because we finally had a clear process.
Another cool thing about these diagrams? They help you spot problems. Like, maybe you notice that most deals stall at the proposal stage. Looking at the diagram, you realize there’s no reminder system for follow-ups. Easy fix—add an automated task in the CRM. Or maybe customer complaints spike after onboarding. The diagram shows that support isn’t looped in until after the sale. So you adjust the process to include a handoff meeting.
They’re also great for training new hires. Instead of saying, “Just figure it out,” you can hand someone the CRM process diagram and say, “This is how we do things here.” It cuts down on ramp-up time and reduces mistakes. New team members feel more confident because they’re not guessing—they’ve got a roadmap.
And don’t think it’s only useful for big companies. Even if you’re a team of five, having a simple version of this diagram helps. Maybe it’s just three steps: lead → contact → customer. But writing it down forces you to think through your process, and that clarity pays off.
Now, building one isn’t always easy. You’ve got to get input from different departments—sales, marketing, customer service, maybe even finance. Because each team touches the customer at different points. If you leave someone out, the diagram won’t reflect reality.

Start by asking questions: How do leads come in? Who owns the first response? What triggers a task in the CRM? How do we track progress? What happens if a deal falls through? Where do support tickets go? Map it all out step by step.
You can draw it on a whiteboard, use sticky notes, or jump straight into software like Lucidchart, Miro, or even PowerPoint. The key is to keep it simple at first. Don’t overcomplicate it. Focus on the main flow. You can always add details later.
And here’s a pro tip: make it living, not static. Your business changes, customers change, tools change. So your CRM process diagram should evolve too. Set a reminder to review it every few months. Ask your team, “Is this still accurate? Are we following it? What’s missing?”
I’ve seen companies create a beautiful diagram, print it out, hang it on the wall… and never look at it again. That’s a waste. It needs to be part of your regular conversations. Use it in team meetings. Refer to it during performance reviews. Update it when you onboard a new tool.
One thing I love is when teams color-code their diagrams. Like green for completed steps, yellow for in-progress, red for bottlenecks. Makes it easier to spot issues at a glance. Or use icons—little phone symbols for calls, envelopes for emails, dollar signs for closed deals. Visuals help people remember.
Also, don’t forget to align it with your CRM setup. If your diagram says “send follow-up email after demo,” make sure your CRM actually has that task built in. Otherwise, people will ignore the diagram because it doesn’t match what’s happening in the system.
And hey, it’s okay if your first version isn’t perfect. Mine definitely wasn’t. I missed a few handoffs, forgot to include re-engagement campaigns, and underestimated how long onboarding takes. But that’s the point—you learn as you go. The diagram improves as your understanding deepens.
Another benefit? It helps with accountability. When everyone sees the process, it’s harder for tasks to fall through the cracks. If a lead isn’t followed up with, you can trace it back: “According to the diagram, Sales should’ve contacted them within 24 hours. Why didn’t that happen?” Was it a system issue? A training gap? A bottleneck? The diagram gives you a starting point for fixing it.
It also makes automation way easier. Once you’ve mapped out the steps, you can start automating repetitive tasks—like sending welcome emails, assigning leads, scheduling reminders. Your CRM can handle a lot of that, but only if you know what needs to happen and when.
And let’s talk about reporting. With a clear process in place, you can measure performance at each stage. How many leads convert to contacts? How long does the sales cycle take? Where do most deals drop off? That data helps you optimize—not just guess what might work.
Honestly, I wish I’d learned about CRM process diagrams years ago. So much stress could’ve been avoided. Miscommunications, lost opportunities, frustrated customers—it often came down to not having a shared understanding of how things should work.
But now that I get it, I see why smart companies swear by them. It’s not about control or micromanaging. It’s about clarity, efficiency, and giving your team the tools they need to succeed.
So if you’re using a CRM—or thinking about getting one—do yourself a favor: take the time to build a CRM process diagram. Sit down with your team, sketch it out, refine it, and keep it alive. It might feel like extra work upfront, but it saves you ten times that effort down the road.
And who knows? You might even enjoy it. There’s something oddly satisfying about seeing your entire customer journey laid out in front of you. It’s like solving a puzzle—and suddenly, all the pieces fit.
Q: What’s the difference between a CRM and a CRM process diagram?
A: Great question! A CRM is the actual software you use to store customer data and manage interactions. A CRM process diagram is a visual map that shows how your team should use that software—what steps to follow, who does what, and when.
Q: Do I need special software to create a CRM process diagram?
A: Not at all. You can start with pen and paper, a whiteboard, or even PowerPoint. Tools like Lucidchart or Miro are helpful for collaboration, but the important thing is the content, not the tool.
Q: How detailed should my CRM process diagram be?
A: Start simple. Focus on the major stages—lead, contact, opportunity, customer. As you get comfortable, you can add more detail like specific tasks, timelines, and responsibilities.
Q: Who should be involved in creating the diagram?
A: Anyone who interacts with customers—sales, marketing, customer support, and even management. Getting input from different teams ensures the diagram reflects real workflows.

Q: How often should I update the diagram?
A: At least every 3–6 months, or whenever you make big changes to your team, tools, or strategy. Treat it like a living document, not a one-time project.
Q: Can a CRM process diagram help with remote teams?
A: Absolutely. In fact, it’s even more important for remote teams since there’s less face-to-face communication. A clear diagram keeps everyone aligned, no matter where they’re working from.
Q: What if my team ignores the diagram?
A: Then it’s either too complicated, not practical, or not being reinforced. Make sure it’s easy to understand, matches your actual CRM setup, and is regularly discussed in meetings.
Q: Is this only for sales-heavy businesses?
A: Nope. Any business that manages customer relationships—service providers, nonprofits, SaaS companies, even freelancers—can benefit from mapping out their CRM process.
Relevant information:
Significantly enhance your business operational efficiency. Try the Wukong CRM system for free now.
AI CRM system.