△Click on the top right corner to try Wukong CRM for free
So, you’ve been asked to write a CRM report. Hmm, sounds kind of formal, right? Like one of those things that only managers or analysts do behind closed doors with spreadsheets open all over the place. But honestly, it doesn’t have to be intimidating. I mean, we’re just talking about putting together information in a way that makes sense—something real people can actually read and understand.
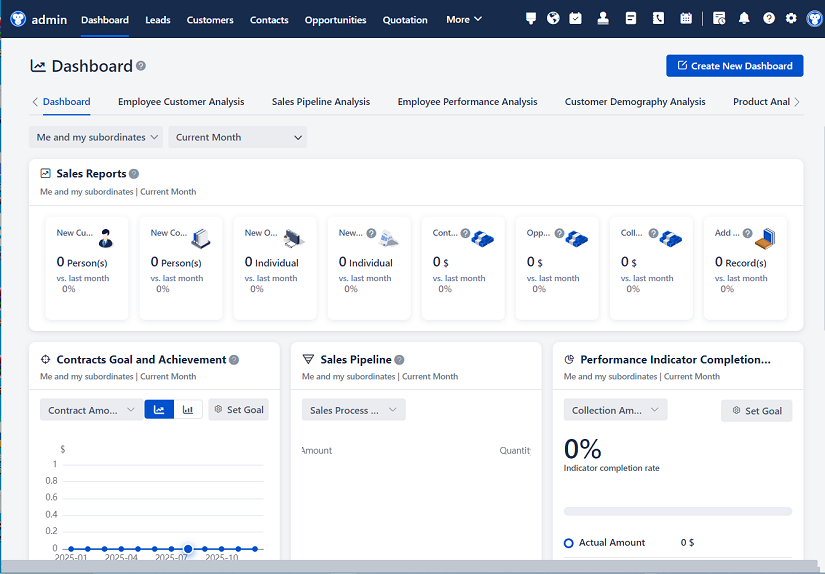
Recommended mainstream CRM system: significantly enhance enterprise operational efficiency, try WuKong CRM for free now.
First off, let’s get real: what even is a CRM report? Well, think of your CRM system—Customer Relationship Management—as this big digital notebook where your company keeps track of every little interaction with customers. Calls, emails, deals closed, complaints, follow-ups—you name it. A CRM report is basically a summary of all that data, pulled together so you can see patterns, measure performance, or figure out what’s working (and what’s not).
Now, when someone asks you to write one, they probably want answers. Maybe sales are down this quarter and they need to know why. Or maybe leadership wants proof that the new onboarding process is helping customer retention. Whatever the reason, your job is to turn raw data into a story—a clear, useful story.
So where do you start? Honestly, the first thing I always do is ask: “Who’s going to read this?” Because if it’s for the CEO, you’ll want high-level insights—big picture stuff, like overall revenue trends or customer satisfaction scores. But if it’s for the sales team, they’ll care more about individual performance, lead conversion rates, or how many follow-ups each rep made last week.
Once you know your audience, you can decide what data matters most. Don’t dump everything in there. That’s like serving a 10-course meal when someone just wanted a sandwich. People will get overwhelmed and stop reading. Instead, pick the key metrics—the ones that actually answer the questions your reader has.
Let me give you an example. Say your boss wants to know why customer churn went up last month. Cool. So you don’t need to include every single support ticket from the past year. You just need to pull data around churned accounts: when they left, how long they were customers, what product they used, whether they had any unresolved complaints, and maybe their engagement level before leaving.
Then, organize it logically. Start with a quick intro—just a sentence or two explaining what the report is about. Something like: “This report analyzes customer churn in Q2 2024, focusing on accounts that canceled their subscriptions.” Simple. Clear. No jargon.
Next, give them the numbers. But don’t just say “churn increased by 15%.” That’s not helpful on its own. Add context. Was that expected? Is it seasonal? How does it compare to last quarter or last year? And hey, throw in a chart or two. People love visuals. A bar graph showing monthly churn rates? Perfect. A pie chart breaking down churn by product line? Even better.
But here’s the thing—don’t just present data. Interpret it. Tell the reader what it means. For instance: “Churn spiked in June, particularly among users of our Basic plan. This coincides with the price increase announced on June 1st, suggesting a possible correlation.” Now you’re not just reporting—you’re analyzing. That’s what makes your report valuable.
And while we’re at it, keep your language human. I know some reports sound like robots wrote them—“Per the data analysis conducted, it has been determined that…” Ugh. Who talks like that? Just say, “We found that…” or “The data shows…” It’s clearer, friendlier, and way easier to read.
Also, watch out for acronyms. Just because you know what MRR or CAC stands for doesn’t mean everyone else does. If you have to use them, spell them out the first time. Better yet, explain them in plain English. “MRR, or Monthly Recurring Revenue, grew by 8% this quarter.”
Now, what about structure? I usually go with something like this:
- Executive Summary (if it’s a longer report)
- Purpose/Objective
- Key Findings
- Data Sources & Methodology (briefly!)
- Detailed Analysis
- Conclusions
- Recommendations
The executive summary is super important if busy people are reading it. Think of it as the “TL;DR” version—two or three paragraphs max, hitting the main points. They might not read the whole thing, but they’ll skim this part.
When you get into the findings, bullet points are your friend. They make things scannable. Like:
- Churn rate increased from 6% to 7.8% in Q2
- 68% of churned customers were on the Basic plan
- Average support response time for these customers was 36 hours—above our 24-hour target
See how much easier that is to digest than a wall of text?
And don’t forget to talk about limitations. No dataset is perfect. Maybe some fields in the CRM weren’t filled out consistently. Maybe the integration with your billing system glitched for a few days. Mentioning that builds trust. It shows you’re not just cherry-picking data—you’re being honest about what you can and can’t conclude.
Now, recommendations. This is where you earn your keep. Don’t just say “churn is bad.” Everyone knows that. Offer solutions. Based on the data, what should the team do? Maybe:

- Revisit pricing strategy for the Basic plan
- Improve first-response times for at-risk customers
- Launch a re-engagement campaign targeting inactive users

Make sure your suggestions are realistic and tied directly to the findings. No wild guesses. If the data doesn’t support it, leave it out.
Oh, and timing matters. When did this happen? Make sure your date range is clear. “Data from April 1 to June 30, 2024” is better than “recent data” or “last quarter” without specifying which.
One thing I always do before sending a report is step away for a bit. Like, close the laptop, grab coffee, come back in 20 minutes. Then read it again like I’ve never seen it before. Does it flow? Is anything confusing? Would my grandma understand it? (Okay, maybe not my grandma, but you get the point.)
And seriously—proofread. Typos kill credibility. Nothing says “I didn’t care” like a report full of spelling mistakes. Use spellcheck, sure, but also read it out loud. Your ears catch errors your eyes miss.
Another tip: save different versions. Keep a draft copy, and once it’s approved, save a final version with a clear name like “CRM_Churn_Report_Q2_2024_Final.” Trust me, you’ll thank yourself later when someone asks for last year’s data.
Now, collaboration. If you’re pulling data from multiple teams—sales, support, marketing—talk to them. Make sure you’re using the same definitions. Is a “lead” anyone who fills out a form? Or only those qualified by sales? Misalignment here can mess up your whole report.
And remember, CRM data isn’t perfect. People forget to log calls. Tags get misapplied. Deals get marked “won” too early. Be aware of those gaps. If something feels off, dig deeper. Maybe cross-check with another source, like your email platform or billing system.
Visuals—let’s talk about them again. They’re not just decoration. A well-designed chart can tell a story faster than a paragraph. But don’t go overboard. One or two good graphs are better than five cluttered ones. Keep colors simple, labels clear, and avoid 3D effects. Nobody needs a pie chart that looks like it’s popping out of the page.
Also, consider accessibility. Not everyone sees color the same way. Use patterns or labels in addition to color so the data is clear even in black and white.
What about tone? Keep it professional but approachable. You’re not writing a legal document. You’re helping people understand something important. So it’s okay to say “we noticed” or “it looks like” instead of “it was observed that.” Sounds more natural.
And hey—if you’re unsure about something, admit it. “We don’t have enough data to determine the exact cause, but early signs suggest…” That’s better than pretending you know everything.
Finally, end with a call to action or next steps. What happens now? Who’s responsible for following up? Should there be a meeting to discuss the findings? Make it easy for people to take the next step.
Writing a CRM report isn’t about showing off how smart you are with data. It’s about helping your team make better decisions. So focus on clarity, honesty, and usefulness. Strip away the fluff. Get to the point. And always, always write like a human talking to another human.
Because at the end of the day, numbers don’t drive change—people do. And people respond to stories, not spreadsheets.
FAQs
Q: What should I include in the introduction of a CRM report?
A: Just a short explanation of what the report is about, why it matters, and who it’s for. Keep it simple—two or three sentences usually do the trick.
Q: How often should CRM reports be created?
A: It depends on your business needs. Weekly for sales teams, monthly for management, quarterly for strategic reviews. Match the frequency to how fast things change in your company.
Q: Can I automate parts of the CRM reporting process?
A: Absolutely. Most CRM platforms like Salesforce or HubSpot let you create dashboards and scheduled reports. Automate the data pull, but still review and add insights manually.
Q: What if my CRM data is incomplete or messy?
A: Acknowledge it in the report. Explain what’s missing and how it might affect your conclusions. Then, focus on the data you can trust.
Q: Should I include every metric in the report?
A: Nope. Only include what’s relevant to the goal. Too much info overwhelms readers. Pick the key few that answer the main question.
Q: How detailed should the methodology section be?
A: Brief but clear. Mention which CRM system you used, the date range, and how you defined key terms (like “active customer” or “closed deal”). Enough so someone could replicate your work.
Q: Who typically writes CRM reports?
A: Sales ops, marketing analysts, customer success managers, or data analysts. But really, anyone who understands the CRM and the business goals can do it.
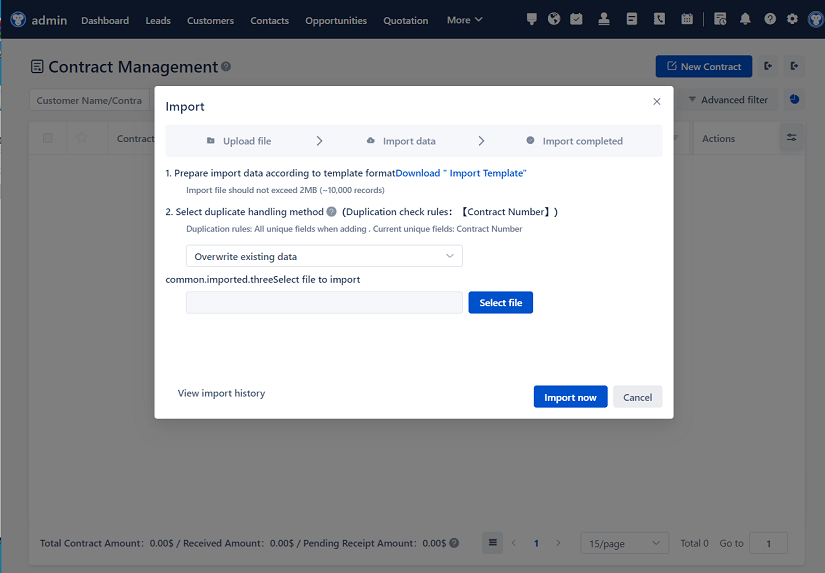
Q: Is it okay to use screenshots from the CRM?
A: Sometimes, especially if you’re highlighting a specific record or workflow. But for trends and summaries, charts and tables are cleaner and easier to read.
Q: How do I make my CRM report more engaging?
A: Use clear headings, bullet points, visuals, and plain language. Tell a story—start with the problem, show what the data says, and end with what to do next.
Q: What’s the biggest mistake people make in CRM reports?
A: Focusing too much on data and not enough on insight. Anyone can export numbers. The value comes from explaining what those numbers mean and what to do about them.
/文章盒子/连广·软件盒子/连广·AI文章生成王/配图/智谱文生图/20251214/1765661524505.jpg)
Relevant information:
Significantly enhance your business operational efficiency. Try the Wukong CRM system for free now.
AI CRM system.