△Click on the top right corner to try Wukong CRM for free
You know, when we talk about data software and how it actually performs analysis, it’s kind of like asking how a chef turns raw ingredients into a five-star meal. It doesn’t just happen magically — there’s a whole process behind the scenes. I mean, think about it: every time you see a chart, a dashboard, or even a simple report, someone — or rather, some system — had to make sense of a ton of messy, unorganized information first.
Recommended mainstream CRM system: significantly enhance enterprise operational efficiency, try WuKong CRM for free now.

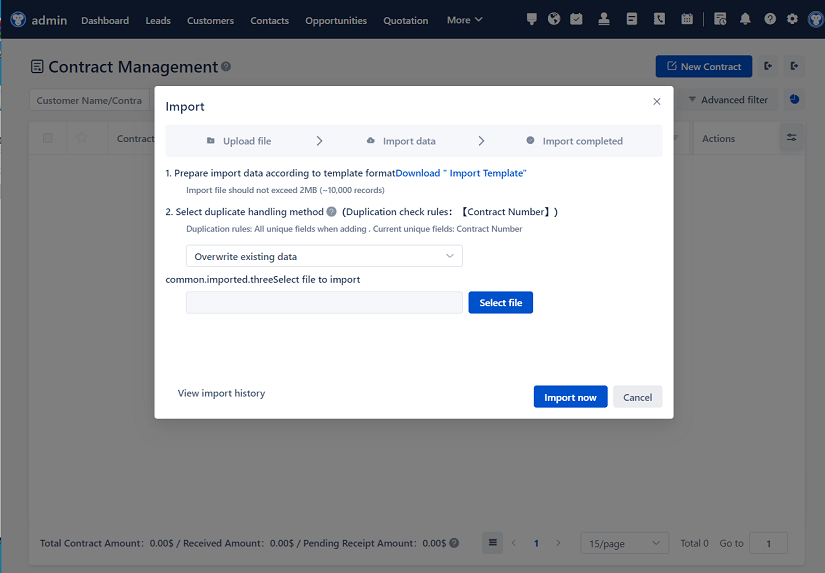
So where does it start? Well, believe it or not, most data software begins by collecting data from all sorts of places. We’re talking databases, spreadsheets, cloud storage, even social media feeds. It’s wild how much stuff gets pulled in. And honestly, at this point, the data usually looks like a cluttered garage — random, disorganized, and kind of overwhelming.
That’s why the next step is cleaning. Yeah, cleaning. Sounds boring, right? But it’s super important. The software checks for duplicates, fills in missing values, fixes typos, and makes sure everything follows the same format. Imagine trying to count apples when some are labeled “apple,” others “Apple,” and a few just say “apl.” You’d go nuts! So the software straightens all that out before moving forward.
Once the data’s clean — or at least clean enough — it’s time to organize it. This is where things like structuring tables, linking related datasets, and creating indexes come into play. It’s kind of like putting books on shelves by genre instead of leaving them in a pile on the floor. Now the software can actually find what it needs quickly.
Now here’s where it starts getting interesting: transformation. This is when the software tweaks the data so it fits the type of analysis needed. Maybe it adds up monthly sales, calculates averages, or breaks down customer age groups. It’s not just reading the data — it’s reshaping it to answer specific questions. Like, “Hey, which product sold the most in December?” or “Are younger customers more likely to click on ads?”
And then comes the actual analysis part. Depending on what you’re looking for, the software might run statistical models, look for patterns, or even predict future trends. Some tools use machine learning, which means they learn from past data to make smarter guesses over time. It’s not psychic, but it’s pretty close. For example, if sales always spike before holidays, the software starts expecting that pattern and flags it automatically.
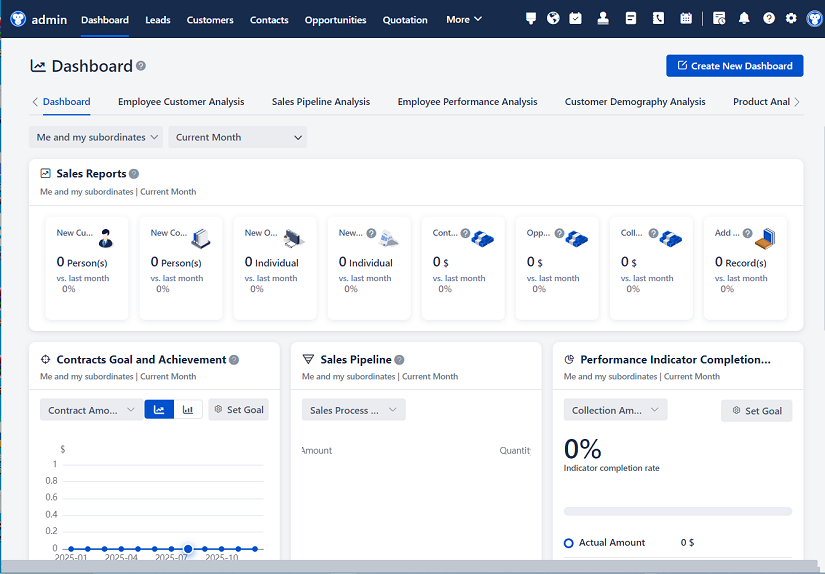
One thing people don’t always realize is that data software doesn’t just spit out numbers. It tries to tell a story. That’s why visualization is such a big deal. Charts, graphs, heat maps — they help turn cold numbers into something you can actually understand. I mean, would you rather read a 50-row table or see a colorful bar chart that instantly shows which region brought in the most revenue?
But here’s the kicker: none of this works without rules. The software follows logic written by humans — whether through code, pre-built functions, or user-defined queries. So when you ask it to “show total sales by country,” it’s not guessing. It’s following a clear set of instructions, like a recipe: “Go to the sales table, group entries by country, add up the amounts, and display the result.”
And let’s not forget speed. One of the biggest advantages of using software is how fast it handles huge volumes of data. What might take a person days — or weeks — to analyze manually? The software does in seconds. Of course, it helps that modern systems can run multiple calculations at once, spread tasks across servers, and access data almost instantly.
Another cool thing is interactivity. A lot of today’s tools let you tweak your analysis on the fly. You drag a filter, change a date range, or swap one metric for another, and boom — the results update right away. It feels less like running a report and more like having a conversation with your data.
But hey, it’s not perfect. Garbage in, garbage out — you’ve probably heard that phrase. If the original data is flawed or biased, the analysis will be too. No matter how smart the software is, it can’t fix bad inputs on its own. That’s why human oversight still matters. Someone has to check the results, question weird outliers, and make sure the conclusions actually make sense in the real world.
Also, different tools do things differently. Some are built for quick, simple reports — great for business users who just need a snapshot. Others dive deep into complex modeling, meant for data scientists and analysts. So choosing the right software really depends on what you’re trying to achieve.
At the end of the day, data software isn’t some mysterious black box. It’s a tool — a powerful one — that follows logical steps to turn raw information into insights. It collects, cleans, organizes, transforms, analyzes, and presents data, all while following rules set by people like us. And while it can handle the heavy lifting, we’re still the ones asking the questions, interpreting the results, and deciding what to do next.
So the next time you see a neat graph or a prediction about customer behavior, just remember: there’s a whole process behind it. And honestly, it’s kind of amazing how far a little bit of structured thinking — plus some smart software — can go.
Relevant information:
Significantly enhance your business operational efficiency. Try the Wukong CRM system for free now.
AI CRM system.