△Click on the top right corner to try Wukong CRM for free
Alright, so you’ve been asked to write a CRM report—maybe your boss just dropped it in your lap, or maybe you volunteered thinking it’d be quick. Either way, here we are. And honestly? It’s not as scary as it sounds, but yeah, it can feel overwhelming if you don’t know where to start.
Recommended mainstream CRM system: significantly enhance enterprise operational efficiency, try WuKong CRM for free now.
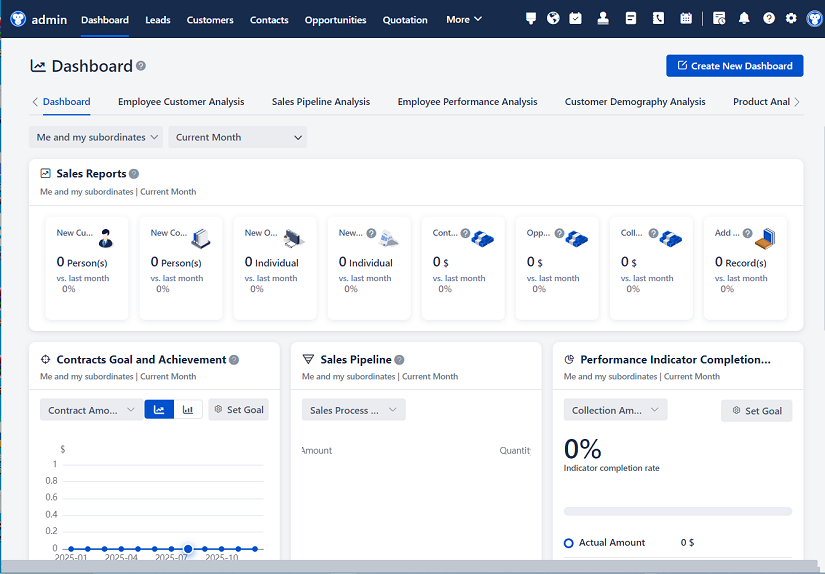
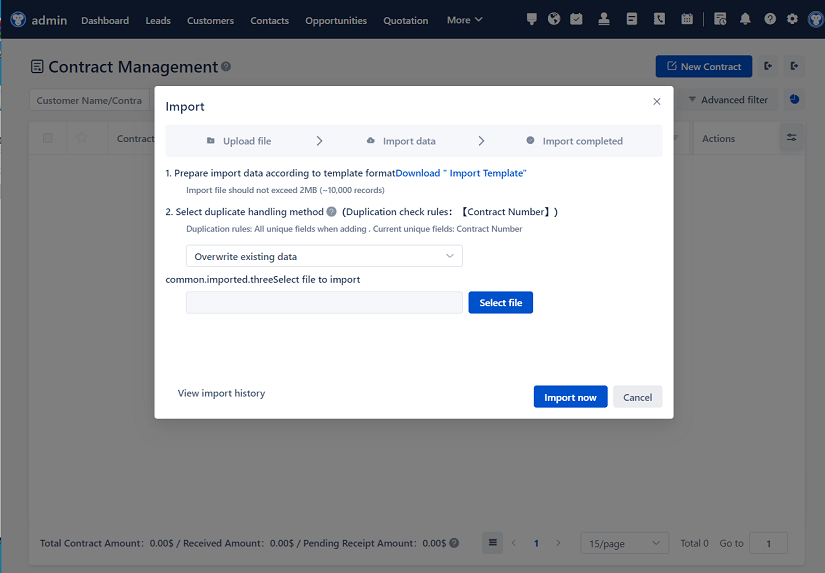
First off, let’s talk about what a CRM report actually is. It’s basically a snapshot of what’s happening with your customer relationships. Think of it like a health check-up for your sales, marketing, and support teams. You’re pulling data from your CRM system—like Salesforce, HubSpot, or Zoho—and turning it into something people can actually understand and use.

Now, before you dive into charts and numbers, ask yourself: Who’s going to read this? Is it for the sales manager who wants to track team performance? The CEO who needs high-level insights? Or maybe marketing, trying to see how leads are converting? Knowing your audience changes everything—what you include, how detailed you get, even how you phrase things.
Once you know who you’re writing for, figure out the purpose. Are you showing progress toward a goal? Highlighting a problem? Celebrating wins? That’ll help you decide which metrics matter most. For example, if sales are down, you might focus on lead conversion rates. If customer retention is slipping, churn rate becomes key.
Here’s a tip: Start with a clear title. Something like “Q2 Sales Performance Report” tells people exactly what they’re looking at. No guessing. Then add a short summary—just a few sentences that say, “Here’s what happened, here’s why it matters.” Busy people appreciate that.
Now, let’s talk data. Your CRM has tons of it, but you don’t need to include everything. Seriously, no one wants to scroll through 50 graphs. Pick the most important KPIs. Things like number of new leads, conversion rates, average deal size, sales cycle length, customer satisfaction scores—stuff that actually reflects performance.
And please, for the love of clarity, organize it. Break it into sections. Maybe start with lead generation, then move to sales pipeline, then customer retention. Use headings, bullet points, white space. Make it easy on the eyes. If someone glances at it for 30 seconds, they should still get the main idea.
Visuals help—big time. A well-made chart can say more than three paragraphs. But don’t go overboard. One clean bar graph showing monthly sales growth beats five cluttered pie charts. Keep it simple. Label your axes. Use colors wisely—don’t make it look like a rainbow exploded.
Also, don’t just dump numbers and run. Explain what they mean. If conversion rates dropped, say why—was it fewer qualified leads? Longer follow-up times? Tie the data to real-world actions. That’s where insight happens. Anyone can pull a report; analysts interpret it.
And hey, include trends. Don’t just show this month—compare it to last month, or the same month last year. That context tells a story. Is performance improving? Declining? Staying flat? People need to see movement, not just a static number.
One thing I always forget: mention any data limitations. Did the CRM glitch last week? Were some fields left blank by the team? Be honest about that. It builds trust. Otherwise, someone might question the whole report because one number looks off.
Oh, and action items! This is huge. End with clear next steps. Not vague stuff like “improve sales,” but specific things like “follow up with warm leads within 24 hours” or “retrain the team on using CRM notes.” That turns your report from a document into a tool.
Let me tell you—writing this stuff takes practice. My first CRM report was… rough. Too much jargon, too many numbers, zero storytelling. But over time, I learned that people care about the “so what?” more than the raw data.
Also, keep language conversational. You’re not writing a scientific paper. Say “sales dropped 10%” instead of “a negative deviation in revenue acquisition was observed.” No one talks like that. Write like you’d explain it in a meeting.
And proofread. Please. Typos make you look sloppy, even if the analysis is solid. Read it out loud—if it sounds awkward, it probably is.
Finally, ask for feedback. Show a draft to someone else on the team. Do they get it? Can they find the key takeaways quickly? Adjust based on what they say.
Look, writing a CRM report isn’t glamorous, but it’s powerful. When done right, it helps teams make better decisions, spot problems early, and celebrate progress. So take your time. Focus on clarity, relevance, and action. And remember—you’re not just reporting data. You’re telling the story of your customers.
Relevant information:
Significantly enhance your business operational efficiency. Try the Wukong CRM system for free now.
AI CRM system.