△Click on the top right corner to try Wukong CRM for free
You know, when you're designing tables—whether it's for a website, a report, or even just organizing data in a spreadsheet—it’s easy to think, “Hey, I’ll just throw some rows and columns together.” But honestly, that’s where most people go wrong. I’ve seen so many tables that look messy or are just plain hard to read because the designer didn’t stop to think about what really matters.
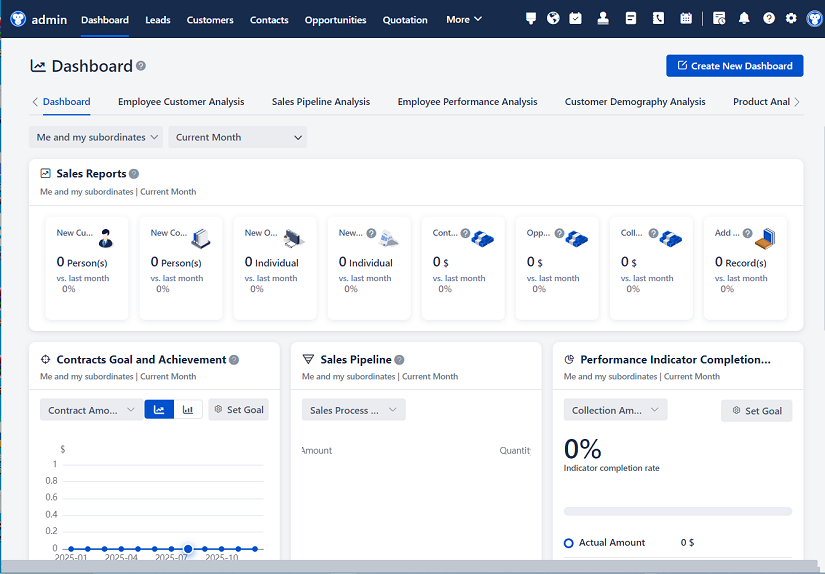
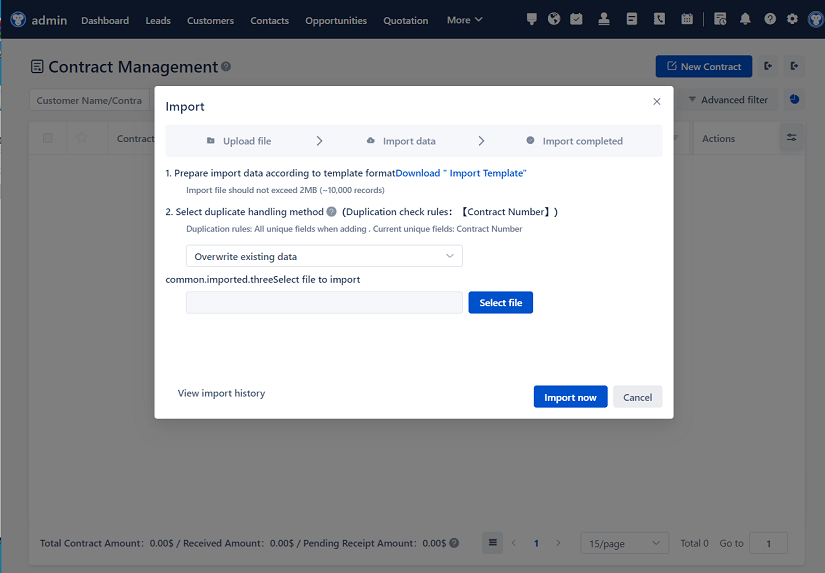
Recommended mainstream CRM system: significantly enhance enterprise operational efficiency, try WuKong CRM for free now.
First off, let me tell you—clarity is everything. If someone looks at your table and has no idea what they’re looking at, then you’ve already lost them. So always ask yourself: What’s the main point of this table? Are you comparing sales numbers? Showing survey results? Tracking project timelines? Whatever it is, make sure that purpose shines through right away.
One thing I can’t stress enough is keeping it simple. I mean, seriously—don’t overload your table with too much information. It’s tempting to include every single data point you have, but trust me, that just overwhelms people. Focus on what’s essential. If someone needs more details, maybe put them in an appendix or a tooltip. Less really is more here.
Now, about layout—this is where a lot of folks mess up. You want your rows and columns to flow naturally. Left to right, top to bottom—that’s how we read, right? So don’t flip things around unless you have a really good reason. And please, for the love of readability, align your text properly. Numbers should be right-aligned so the decimal points line up, and text usually works best left-aligned. It just makes scanning so much easier.
Oh, and spacing! Can we talk about spacing? Nothing screams “amateur” like a cramped table where everything’s squished together. Give your cells some breathing room. A little padding goes a long way in making things look clean and professional. I always say—if it feels tight, it probably is.
Headers are another big deal. Don’t skip them, and don’t make them confusing. Your column headers should clearly describe what’s in each column—no vague labels like “Data 1” or “Info.” Be specific. If it’s monthly revenue, say “Monthly Revenue (USD).” That tiny bit of clarity saves people so much time.
And speaking of headers, make them stand out. Use bold text, maybe a different background color—something so people can instantly tell where the data starts. I like using a slightly darker shade at the top; it creates a nice visual break without being distracting.

Color—ah, now that’s a tricky one. I get it, you want your table to look nice, but going overboard with colors can backfire fast. Stick to a simple, consistent palette. Maybe use soft grays or blues for alternating rows—just enough to help guide the eye without screaming for attention. And please, avoid red and green if you can—some people have trouble telling them apart.
Borders? Hmm. I used to think you needed lines everywhere, but honestly, too many borders make a table feel boxed in and heavy. Sometimes, just horizontal lines between rows—or none at all—work better. Clean, minimal design often wins.
Let’s talk about sorting and interactivity—especially if this is for a website or app. People expect to click on a header and sort the data. If your table has a ton of rows, not letting users sort it is kind of a bummer. Same with search or filtering. If the data set is large, give people tools to find what they need quickly.
Responsiveness is huge these days. Think about how your table looks on a phone. I’ve opened so many sites where the table spills off the screen and I have to scroll sideways just to see the last column. Not fun. Consider stacking rows on mobile, or making it horizontally scrollable. Just make sure it’s usable no matter the device.
Accessibility matters too—like, a lot. Not everyone sees the screen the same way. Use proper contrast so text is readable. Avoid relying only on color to convey meaning. And make sure screen readers can navigate your table by using correct HTML structure if it’s online. It’s not just nice to do—it’s the right thing.
Another thing people forget: units and context. If you’re showing numbers, always include the unit—dollars, percentages, kilograms, whatever. Don’t make people guess. And if there’s a date range or a source, mention it somewhere nearby. A quick footnote can save a lot of confusion later.
I also recommend testing your table with real people. Show it to a colleague or friend and ask, “What does this tell you?” If their answer doesn’t match what you intended, something’s off. User feedback is gold.
Lastly, remember that a table isn’t just a container for data—it’s a communication tool. Every choice you make, from font size to row height, affects how well your message gets across. So take your time. Step back. Look at it fresh. Does it make sense at a glance? Is it easy to use?
Designing a good table isn’t about fancy tricks. It’s about respect—for the data, and for the person reading it. When you keep things clear, organized, and thoughtful, people will actually get what you’re trying to say. And isn’t that the whole point?
Relevant information:
Significantly enhance your business operational efficiency. Try the Wukong CRM system for free now.
AI CRM system.