△Click on the top right corner to try Wukong CRM for free
Alright, so you know how sometimes you feel like your customer data is just… everywhere? Like, it’s in emails, spreadsheets, random sticky notes—honestly, it’s a mess. And then someone asks you, “Hey, how many customers actually bought something last month?” and you’re just sitting there, staring at your screen, wishing you had a magic button. Well, guess what? That magic button kind of exists—and it’s called a CRM report.
Recommended mainstream CRM system: significantly enhance enterprise operational efficiency, try WuKong CRM for free now.
I’ve been there. I used to spend hours digging through my CRM trying to make sense of things. But once I figured out how to create proper reports, everything changed. It wasn’t overnight, though. Took some trial and error. But now? I can pull up insights in minutes instead of wasting half my day.
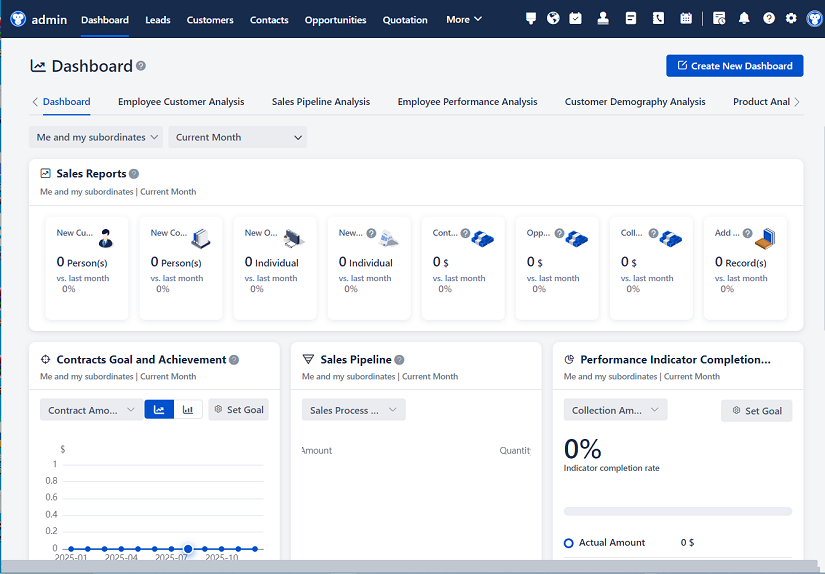
So let’s talk about how you can do the same. First off, what even is a CRM report? Honestly, it’s just a way to take all that messy customer data you’ve collected and turn it into something useful—like numbers, charts, or lists that actually tell you what’s going on with your business.
Think of it like this: your CRM is like a giant filing cabinet full of customer info. A report is like pulling out only the files you need for a specific reason—say, all the people who haven’t bought anything in six months. That way, you’re not flipping through every single file; you’re getting straight to the point.
Now, before you jump into building a report, ask yourself: What do I actually want to know? Because if you don’t have a clear goal, you’ll end up with a report that looks fancy but doesn’t help you at all. For example, are you trying to see which sales rep closed the most deals last quarter? Or maybe you want to find out which marketing campaign brought in the most leads?
Once you know your goal, you can start thinking about what data you need. Most CRMs—like Salesforce, HubSpot, Zoho—let you build custom reports based on different fields. So if you want to track sales performance, you might pull in data like deal size, close date, stage, and owner. If you’re looking at lead sources, you’d focus on where the lead came from, their status, and maybe conversion rate.
Here’s a little secret: most people skip setting filters, and that’s where things go wrong. Without filters, your report shows everything, and honestly, that’s overwhelming. Say you only care about deals closed in January. Just add a filter for “Close Date = January 2024.” Boom—suddenly, your report is focused and useful.
And speaking of filters, be careful not to overdo it. I made that mistake once. I added like seven filters trying to get the “perfect” view, and ended up with zero results. Frustrating, right? So start simple. One or two key filters usually do the trick. You can always tweak them later.
Another thing—grouping. This one’s super helpful. Let’s say you want to compare how each salesperson is doing. Instead of seeing a long list of individual deals, group the results by “Owner.” Now you’ll see totals for each person, and you can spot trends fast. Maybe Sarah crushed her quota while John’s been quiet lately. That’s valuable info.
Visuals matter too. Sure, you can look at a table of numbers, but wouldn’t it be easier to see a bar chart showing monthly revenue? Most CRMs let you switch between tables, charts, and even maps. I’m a big fan of pie charts when I’m looking at lead sources—gives me a quick visual of where most of my traffic is coming from.
But here’s the thing—don’t get carried away with making it pretty. The goal isn’t to win a design award; it’s to understand your business better. So pick a chart type that makes sense for the data. Line charts for trends over time, bar charts for comparisons, pie charts for proportions. Keep it simple.
Now, naming your report? Yeah, that sounds boring, but trust me—it matters. I used to name mine stuff like “Report_1” or “Final_Final_v2.” Big mistake. Six months later, I had no idea what any of them were for. Now I use clear names like “Q1 Sales Performance by Rep” or “Monthly Lead Conversion Rate.” Makes life so much easier.
And save it! Don’t just run the report and close it. Save it so you can come back to it later or share it with your team. Most CRMs let you schedule reports to run automatically—weekly, monthly, whatever. I have a few set to email my manager every Monday morning. Saves us both time.
Oh, and permissions—this trips people up all the time. Just because you can see certain data doesn’t mean everyone on your team should. Make sure you set the right access levels. For example, maybe only managers should see revenue numbers, while reps only see their own deals. Keeps things secure and avoids awkward questions.
Let’s talk about real-time vs. static data. Some reports update live, others are snapshots. Know the difference. If you’re presenting to leadership, you probably want the latest numbers. But if you’re analyzing last quarter’s performance, a static version is fine. Just be aware of when the data was pulled.
One thing I wish someone had told me earlier: test your report with a small dataset first. Run it on just ten records to make sure the logic works. I once built a report that was supposed to show high-value leads, but because of a typo in the filter, it showed the lowest-value ones. Awkward moment in the team meeting.

Also, keep your CRM clean. Garbage in, garbage out, right? If your team isn’t entering data consistently—like spelling “California” as “CA,” “Calif,” and “Cali”—your reports will be junk. So encourage good data hygiene. Maybe even run a quick training session.
Custom fields are another game-changer. Standard CRM fields are great, but sometimes you need more. For example, we added a field for “Preferred Contact Method” because we noticed some customers hate phone calls. Now we can filter reports to only email-friendly leads. Small change, big impact.
Time frames matter too. Are you looking at last week? Last year? Year-to-date? Be specific. I once compared January sales to December and panicked because revenue dropped—forgot that December had holiday spikes. Duh. Context is everything.
Want a pro tip? Use summary reports for leadership and detailed ones for operations. Execs want the big picture—total revenue, growth rate, key wins. Your sales team needs the nitty-gritty—individual deals, follow-up dates, next steps. Tailor the report to the audience.
And don’t forget mobile access. I check my key reports on my phone during my commute. Most CRMs have apps that let you view reports on the go. Super handy when you’re in a meeting and someone asks a quick question.
Integration is cool too. If your CRM connects to your email, calendar, or marketing tools, you can pull in even richer data. Like, did that webinar really drive new leads? Pull a report that ties event attendance to lead creation. Suddenly, you can prove ROI.
But hey, don’t expect perfection the first time. I’ve rebuilt reports three, four times before getting them right. That’s normal. Talk to your team, ask what they need, and iterate. Reports aren’t set-and-forget—they evolve as your business does.
One last thing: share insights, not just data. Don’t just send a report and say “here’s the numbers.” Add a quick note like, “Looks like our east region is underperforming—let’s discuss in the next meeting.” That turns raw data into action.
Honestly, once you get the hang of it, creating CRM reports becomes second nature. It’s like learning to ride a bike—you wobble at first, but soon you’re cruising. And the payoff? Huge. You’ll make smarter decisions, impress your boss, and actually understand what’s working (and what’s not).
So go ahead. Open your CRM. Pick one question you’ve been avoiding because the data feels messy. Build a report to answer it. Start small. You’ve got this.
FAQs (Frequently Asked Questions)
Q: Can I create a CRM report without knowing how to code?
A: Absolutely! Most modern CRMs are designed for non-technical users. You just click, drag, and select options—no coding needed.
Q: How often should I update my CRM reports?
A: It depends on your needs. Daily for fast-moving teams, weekly for most, and monthly for strategic reviews. You can even automate them.
Q: What if my report shows weird or incorrect data?
A: First, double-check your filters and date ranges. Then, look at the source data—often, the issue is outdated or inconsistent entries in the CRM.
Q: Can I share CRM reports with people outside my company?
A: Yes, but be careful. Most systems let you export reports as PDF or Excel, or share via secure links with limited access.
Q: Should I create one big report or several smaller ones?
A: Smaller, focused reports are usually better. They’re easier to understand and maintain. Think quality over quantity.

Q: How do I know which metrics to include in my report?
A: Start with your goal. If you want to improve sales, track conversion rates, deal size, and cycle length. If it’s marketing, focus on lead volume and source.
Q: Can I schedule a report to run automatically?
A: Yep! Most CRMs let you schedule reports to run and email them to you or your team on a regular basis.
Q: What’s the biggest mistake people make with CRM reporting?
A: Not defining a clear purpose. If you don’t know what question you’re answering, your report won’t help you make decisions.
Q: Do I need special permissions to create reports in my CRM?
A: Sometimes. Depending on your CRM and role, you might need admin access to create or edit certain reports.
Q: Can I combine data from multiple CRMs into one report?
A: It’s tricky, but possible with integration tools or exporting/importing data. However, it’s usually better to centralize your data first.
Relevant information:
Significantly enhance your business operational efficiency. Try the Wukong CRM system for free now.
AI CRM system.