△Click on the top right corner to try Wukong CRM for free
You know, when I first started working with CRM data, I honestly had no idea what I was doing. I mean, I could pull reports and see numbers all day long, but understanding what those numbers actually meant? That was a whole different story. It wasn’t until I took a step back and really started asking questions—like, “Why are we tracking this?” or “What’s the real goal behind this metric?”—that things began to make sense.
Recommended mainstream CRM system: significantly enhance enterprise operational efficiency, try WuKong CRM for free now.
So let me tell you something: analyzing CRM reports isn’t just about crunching numbers. It’s about telling a story. Every chart, every percentage, every trend line—it’s all part of a bigger picture. And if you don’t look at it like that, you’re missing the point entirely.
I remember one time, my team pulled a report showing a 20% increase in lead conversion over three months. At first glance, everyone was thrilled. High fives all around. But then I asked, “Wait, where are these leads coming from?” Turns out, most of them were from a single marketing campaign that cost way more than we’d budgeted. So yeah, conversions went up, but profitability? Not so much. That taught me a big lesson: context is everything.
When you're diving into CRM report analysis, the first thing you should do is define your objective. What are you trying to figure out? Are you looking to improve sales performance? Understand customer behavior? Optimize marketing spend? Without a clear goal, you’re just spinning wheels. Trust me, I’ve been there. You can have the fanciest dashboard in the world, but if you don’t know what question you’re answering, it’s just noise.
Once you’ve got your goal in mind, start by identifying the key metrics that matter. For sales teams, that might be conversion rates, average deal size, or sales cycle length. For marketing, it could be lead source effectiveness, email open rates, or cost per acquisition. Customer service folks might care more about response times, resolution rates, or customer satisfaction scores. The point is, not every number is equally important. Focus on the ones that directly tie back to your goals.
And here’s a tip: don’t get overwhelmed by data overload. I used to think more data = better decisions. But after spending hours staring at spreadsheets full of irrelevant stats, I realized that’s not true at all. In fact, too much data can actually cloud your judgment. Pick a few core KPIs and stick with them. You can always dig deeper later if needed.
Now, let’s talk about segmentation. This is one of the most powerful tools in CRM analysis, and honestly, it’s underused. Instead of looking at your entire customer base as one giant blob, break it down. Segment by geography, industry, company size, purchase history—you name it. When you do this, patterns start to emerge. Maybe your enterprise clients have a much longer sales cycle than SMBs. Or maybe customers in the Midwest respond better to certain types of messaging. These insights are gold.
I once worked with a client who thought their product appeal was universal. But after segmenting their CRM data by customer type, we discovered that 80% of their revenue came from just two industries. That completely changed their go-to-market strategy. They stopped wasting time chasing unqualified leads and doubled down on what was already working. Sometimes the biggest wins come from simply seeing what’s right in front of you.
Another thing people overlook is time-based analysis. Trends don’t happen in a vacuum. You’ve got to look at how metrics change over time. Is your conversion rate improving month over month? Are support tickets spiking during certain seasons? Plotting data on a timeline helps you spot seasonality, identify anomalies, and forecast future performance.
Let me give you an example. A retail client noticed a dip in new sign-ups every August. At first, they panicked. But when they looked at historical data, they saw the same pattern for the past three years. Turns out, summer vacations were slowing things down. Once they knew that, they adjusted their expectations and shifted campaigns to July and September instead. Problem solved—just by looking at the timeline.
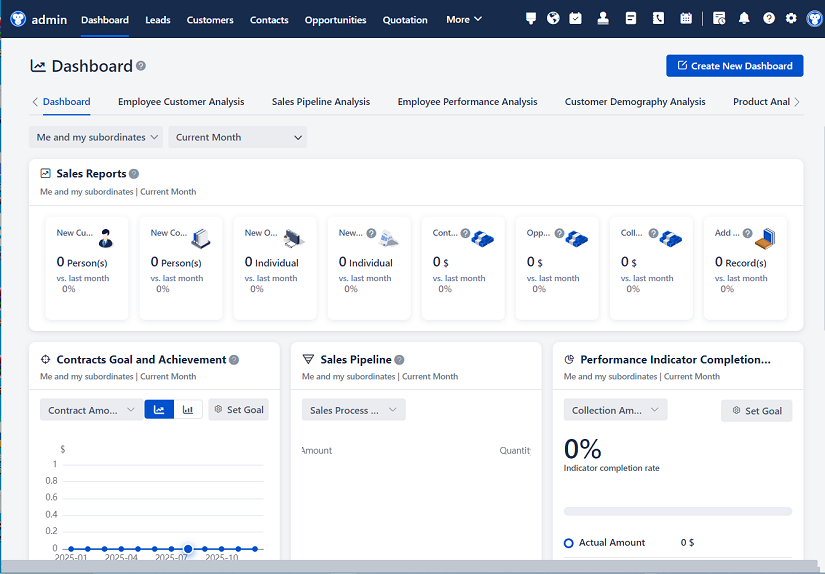
One of the coolest things about modern CRM systems is the ability to create custom dashboards. I love this because it lets you visualize data in a way that makes sense to you and your team. But here’s the catch: a dashboard is only as good as the questions it answers. Don’t just throw every metric onto a screen and call it a day. Think about who’s using it and what decisions they need to make. Sales managers might want pipeline health, while executives care more about revenue forecasts.
And speaking of visuals—use them wisely. A well-designed chart can communicate more in ten seconds than a paragraph of text. But a cluttered, confusing graph? That’s worse than useless. Keep it simple. Use bar charts for comparisons, line graphs for trends, pie charts sparingly (they’re often misleading), and always label your axes. Your brain processes visuals faster than numbers, so make sure what you’re showing actually helps, not hinders.
Now, let’s talk about benchmarking. How do you know if your numbers are good? You compare them—to past performance, to industry standards, to team averages. If your sales team closes deals in 45 days on average, but the industry standard is 30, that’s a red flag worth investigating. Benchmarking gives you perspective. It turns raw data into actionable insight.
But be careful—don’t fall into the trap of vanity metrics. Likes, followers, page views—they sound impressive, but do they drive real business outcomes? Probably not. Focus on metrics that impact revenue, retention, or efficiency. That’s where the real value lies.
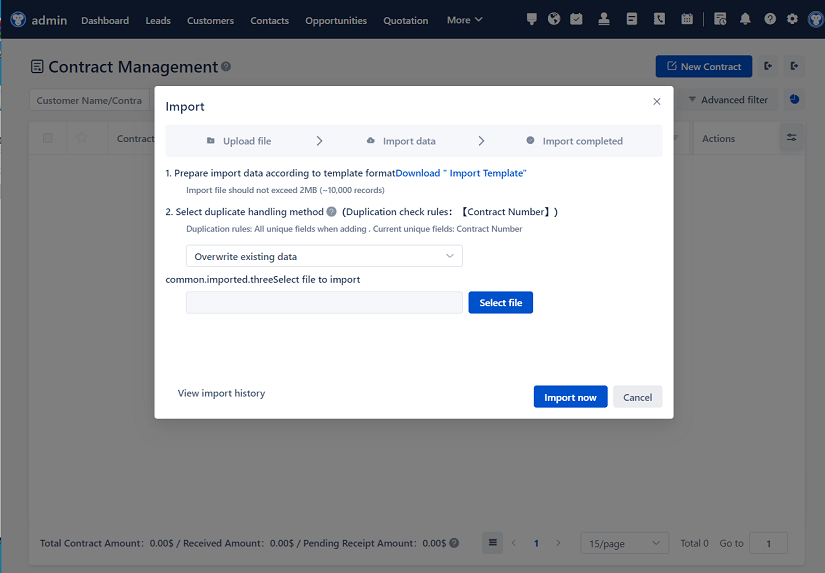
Another thing I’ve learned: always validate your data. Garbage in, garbage out. If your CRM is full of outdated contact info, duplicate entries, or incomplete records, your analysis will be flawed. Take time to clean your data regularly. Remove duplicates, update fields, enforce input rules. It’s not glamorous work, but it’s essential.
And hey, don’t forget about qualitative data. CRM systems track a lot of numbers, but they also store notes, call summaries, and customer feedback. These little snippets can explain why something is happening. Maybe a deal fell through because of pricing concerns. Or maybe a customer renewed because they loved the onboarding experience. Numbers tell you what, but qualitative data tells you why. Use both.

Collaboration is another big piece of the puzzle. CRM analysis shouldn’t happen in a silo. Talk to sales reps—they’ll tell you what’s really going on in the field. Chat with customer support—they hear the complaints and compliments firsthand. Marketing can share insights on campaign performance. When you bring different perspectives together, your analysis becomes richer and more accurate.
I’ll never forget the time I presented a detailed CRM report to leadership, full of charts and projections. Everyone nodded along, seemed impressed. Then the head of sales raised his hand and said, “This is great, but last month we lost our top account manager, and that’s why pipeline velocity dropped.” I hadn’t even considered staffing changes! From that day on, I made it a rule: always talk to the people before finalizing any analysis.
Automation can be a huge help too. Most CRMs let you set up alerts, scheduled reports, and workflow triggers. For example, if a high-value opportunity hasn’t been updated in two weeks, the system can notify the rep. Or if customer satisfaction drops below a certain threshold, it flags it for review. These little nudges keep teams proactive instead of reactive.
But—and this is important—don’t rely on automation to replace thinking. Tools are helpful, but they don’t replace human judgment. Always ask, “Does this make sense?” If a report shows a sudden spike in churn, don’t just accept it. Dig deeper. Was there a recent product change? A service outage? A competitor launch? The system won’t tell you that. You have to.
One last thing: make your findings actionable. Analysis for analysis’ sake is pointless. Every report should end with clear recommendations. Should we retrain the sales team on objection handling? Pause a low-performing ad campaign? Reach out to at-risk customers? If you can’t answer “So what?” then you haven’t finished the job.
And remember, CRM analysis isn’t a one-time thing. It’s an ongoing process. Markets change. Customers evolve. Strategies shift. Revisit your reports regularly. Update your dashboards. Refine your KPIs. Stay curious.
Honestly, the more I work with CRM data, the more I realize it’s not about being a data scientist. It’s about being a detective. You’re gathering clues, connecting dots, and solving puzzles. And when you get it right? When your analysis leads to a smarter decision, a saved deal, a happier customer? That’s when it all clicks.
So next time you open your CRM report, don’t just scan the numbers. Ask questions. Look for patterns. Talk to people. Think critically. Because behind every data point is a human story waiting to be told.
Q&A Section
Q: How often should I review CRM reports?
A: It depends on your business, but weekly check-ins for operational teams and monthly deep dives for leadership usually work well. Real-time dashboards are great for daily monitoring.
Q: What’s the most common mistake people make with CRM analysis?
A: Focusing on too many metrics at once. Start small—pick 3–5 key indicators that align with your goals and master those first.
Q: Can CRM data help with customer retention?
A: Absolutely. By tracking engagement, support history, and renewal patterns, you can identify at-risk customers and reach out proactively.

Q: How do I know if my CRM data is accurate?
A: Run regular audits. Check for duplicates, missing fields, and inconsistent formatting. Also, ask your team how reliable they think the data is—frontline feedback matters.
Q: Should I share CRM reports with the whole team?
A: Yes, but tailor the content. Sales reps need different insights than marketers. Transparency builds accountability and alignment.
Q: What if my CRM doesn’t have the reports I need?
A: Most systems allow custom reporting. Learn the tool, or work with your admin to build what you need. If it’s still lacking, consider whether your CRM fits your business.
Q: How can I make my CRM analysis more impactful?
A: Tell a story. Start with the problem, show the data, explain what it means, and end with clear actions. People remember stories—not spreadsheets.
Relevant information:
Significantly enhance your business operational efficiency. Try the Wukong CRM system for free now.
AI CRM system.