△Click on the top right corner to try Wukong CRM for free
You know, when I first heard about CRM statistical analysis methods, I thought it was just another tech buzzword—something marketers throw around in meetings to sound smart. But honestly, the more I dug into it, the more I realized how powerful and practical it really is. Like, think about it: every time someone visits your website, clicks an email, or buys a product, they’re leaving behind little digital footprints. And CRM systems? They collect all that data so you can actually make sense of it.
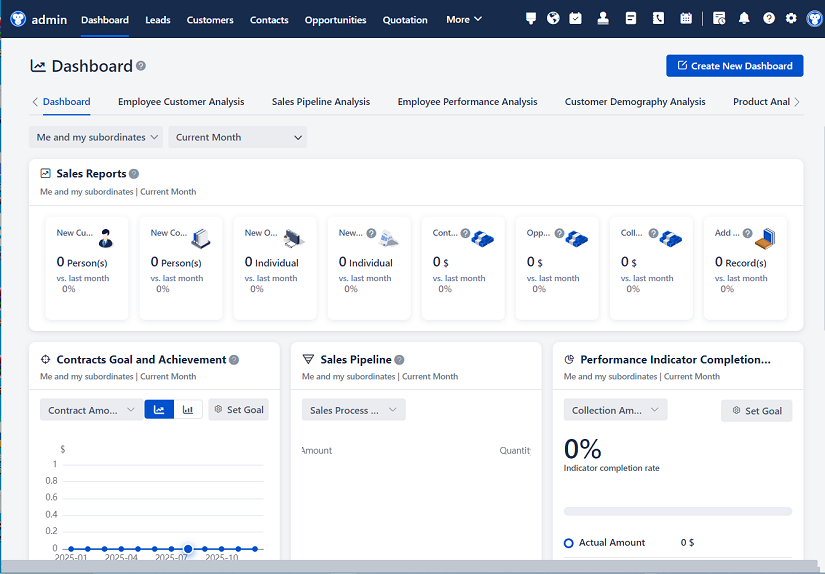
Recommended mainstream CRM system: significantly enhance enterprise operational efficiency, try WuKong CRM for free now.
Now, here’s the thing—not everyone uses this data well. A lot of companies just store it and forget it, like old clothes in the back of a closet. But the smart ones? They use statistical analysis to turn that raw data into real insights. It’s kind of like having a crystal ball, but instead of magic, it’s math and logic doing the heavy lifting.
Let me break it down for you. One of the most common methods people use is regression analysis. Yeah, I know—it sounds super technical, but it’s actually pretty straightforward. Imagine you want to figure out what drives customer purchases. Is it price? Email frequency? Product reviews? Regression helps you see which factors actually matter and by how much. For example, you might find out that sending emails twice a week increases sales by 15%, but after three times, people start unsubscribing. That’s useful stuff!
And then there’s clustering. Ever walked into a store and felt like they totally “get” you? That’s probably because they’ve used clustering to group customers based on behavior, preferences, or demographics. It’s not mind reading—it’s statistics. You take all your customers and sort them into buckets: maybe frequent buyers, bargain hunters, or loyal brand advocates. Once you know who’s who, you can tailor your messages and offers. It’s way better than blasting the same promo to everyone and hoping something sticks.
I remember talking to a friend who runs a small online shop. She told me she started using segmentation through basic clustering, and her open rates jumped almost overnight. She wasn’t sending diaper coupons to pet owners anymore—makes sense, right?
Another method that’s super helpful is classification. This one’s great for predicting outcomes. Let’s say you want to know which customers are likely to churn. Classification models—like decision trees or logistic regression—can analyze past behavior and flag those at risk. Then you can reach out with a special offer or a friendly check-in before they disappear. It’s like catching a leaky faucet before it floods your kitchen.
What’s cool is that these models get smarter over time. The more data you feed them, the better they predict. It’s not perfect, of course—no model is—but it beats guessing. I mean, would you rather rely on gut feeling or actual patterns from thousands of customer interactions?
Then there’s time series analysis. This one’s all about trends over time. Think monthly sales, seasonal spikes, or even daily website traffic. By analyzing historical data, you can forecast future behavior. Retailers do this all the time—like predicting holiday demand so they don’t run out of stock. It’s also handy for spotting anomalies. If sales suddenly drop in one region, you can investigate fast instead of waiting months to notice.
I once worked with a team that ignored time series data, and guess what? They were caught off guard when summer sales dipped. Turns out, their biggest customer segment goes offline during vacation season. Had they looked at past trends, they could’ve adjusted their campaigns. Lesson learned the hard way.
Survival analysis is another method that sounds intense but is actually brilliant. No, it’s not about surviving the apocalypse—it’s about understanding how long customers stick around. In business terms, we call it “customer lifetime.” This method helps you estimate how long a customer will stay active before churning. It takes into account things like purchase intervals, engagement levels, and support interactions.
For subscription-based businesses, this is gold. Knowing the average lifespan of a customer helps with forecasting revenue and planning retention strategies. Plus, you can test what extends that lifespan—like onboarding emails or loyalty rewards—and measure the impact statistically.
Now, let’s talk about association rule mining. Sounds fancy, doesn’t it? But really, it’s just about finding patterns in what people buy together. You’ve seen those “Customers who bought this also bought…” suggestions online? That’s association rules in action. Retailers use it to optimize product placement, create bundles, and improve cross-selling.
I remember buying a laptop case and suddenly getting ads for screen cleaners and USB hubs. At first, I thought it was creepy. Then I realized it was just smart data use. And honestly? I ended up buying the cleaner because it made sense. So, it works.
Factor analysis is a bit more behind-the-scenes, but still super valuable. It helps simplify complex data by identifying hidden variables—what we call “factors.” For example, customer satisfaction might depend on dozens of survey questions, but factor analysis can boil it down to a few key drivers, like service speed, product quality, and support friendliness. That makes it easier to act on feedback without getting lost in the noise.
And don’t get me started on principal component analysis (PCA). It’s similar but focuses on reducing data dimensions while keeping the important info. Think of it like compressing a high-res photo into a smaller file without losing clarity. Businesses use it when they have too many variables and need to focus on what truly matters.
One thing I’ve noticed is that people often overlook data quality. No matter how fancy your method is, garbage in means garbage out. If your CRM has duplicate entries, missing values, or outdated info, your analysis will be off. Cleaning data isn’t glamorous, but it’s essential. I’ve seen teams spend weeks building a model, only to realize half the customer emails were invalid. Total waste of time.
Also, context matters. A statistical result might look solid on paper, but if it doesn’t make sense in real life, question it. Like, if your model says customers aged 90+ are your fastest-growing segment, but your product is mobile gaming apps… yeah, something’s wrong. Always cross-check with reality.

Another point—interpretability. Some models, like deep learning networks, are super accurate but act like black boxes. You get a prediction, but no clue why. In CRM, that’s risky. Sales and marketing teams need to understand the “why” behind insights so they can act confidently. That’s why simpler models like logistic regression or decision trees are often preferred—they’re transparent and easier to explain.
Integration is key too. Your CRM shouldn’t live in a silo. It needs to connect with your email platform, website analytics, social media, and support tools. Otherwise, you’re only seeing part of the picture. Full visibility leads to better analysis. I’ve seen companies miss major opportunities because their sales data wasn’t synced with customer service logs. Turns out, frustrated customers weren’t buying again—but nobody knew until they connected the dots.

And hey, ethics can’t be ignored. Just because you can analyze every click and scroll doesn’t mean you should without consent. Customers care about privacy. Be transparent. Use data to improve their experience, not manipulate them. Trust is way more valuable than short-term gains.
Let’s not forget visualization. Numbers alone can be overwhelming. Charts, graphs, and dashboards help teams grasp insights quickly. A well-designed heatmap can show regional sales trends faster than a spreadsheet ever could. And when leadership can see the story in the data, decisions happen faster.
Training matters too. I’ve met teams with amazing CRM tools but no idea how to use them. Investing in training—or hiring analysts—pays off. Even teaching basic filtering and reporting skills empowers employees to explore data on their own. Curiosity leads to discovery.
Finally, iteration. Analysis isn’t a one-time project. Customer behavior changes. Markets shift. Models need regular updates. Set up routines to re-evaluate assumptions, refresh data, and test new approaches. Stay curious. Stay flexible.
Look, CRM statistical analysis isn’t about replacing human intuition. It’s about enhancing it. The best decisions come from blending data-driven insights with real-world experience. Numbers tell you what’s happening; people figure out why and what to do next.
So whether you’re a small business owner or part of a big corporate team, don’t shy away from these methods. Start simple. Try basic segmentation. Run a quick regression. See what you learn. You don’t need a PhD—just curiosity and a willingness to learn.
Because at the end of the day, it’s all about understanding your customers better. And when you do that, everything else—sales, loyalty, growth—starts to fall into place.
Q&A Section
Q: What’s the easiest CRM statistical method for beginners to start with?
A: Honestly, basic segmentation or clustering is the most beginner-friendly. You can start by grouping customers by purchase frequency or location using simple filters in your CRM. No advanced math needed at first.
Q: Do I need to know programming to use these methods?
A: Not necessarily. Many CRM platforms now have built-in analytics tools with drag-and-drop interfaces. But if you want deeper analysis, learning basics of Excel, SQL, or tools like Python can help a lot.
Q: How often should I update my CRM analysis?
A: It depends on your business pace. Monthly reviews are common, but for fast-moving industries, weekly or even daily checks make sense. The key is consistency.
Q: Can small businesses benefit from CRM statistical analysis too?
A: Absolutely! In fact, small businesses often see bigger relative gains because even small improvements in retention or conversion can have a big impact.
Q: What’s the biggest mistake people make with CRM data analysis?
A: Probably jumping to conclusions without validating the data. Always check for errors, biases, or incomplete records before running any analysis.
Q: Is machine learning necessary for effective CRM analysis?
A: Not at all. Traditional statistical methods like regression and clustering solve most common business problems. Machine learning is helpful for complex predictions, but it’s not required for success.
Q: How do I know which method to use for my specific goal?
A: Match the method to your question. Want to predict churn? Try classification. Looking for customer groups? Use clustering. Trying to understand drivers of sales? Go with regression.
Q: Can CRM analysis improve customer service?
A: Definitely. By identifying at-risk customers or common pain points, support teams can act proactively and personalize their responses, leading to better experiences.
Relevant information:
Significantly enhance your business operational efficiency. Try the Wukong CRM system for free now.
AI CRM system.