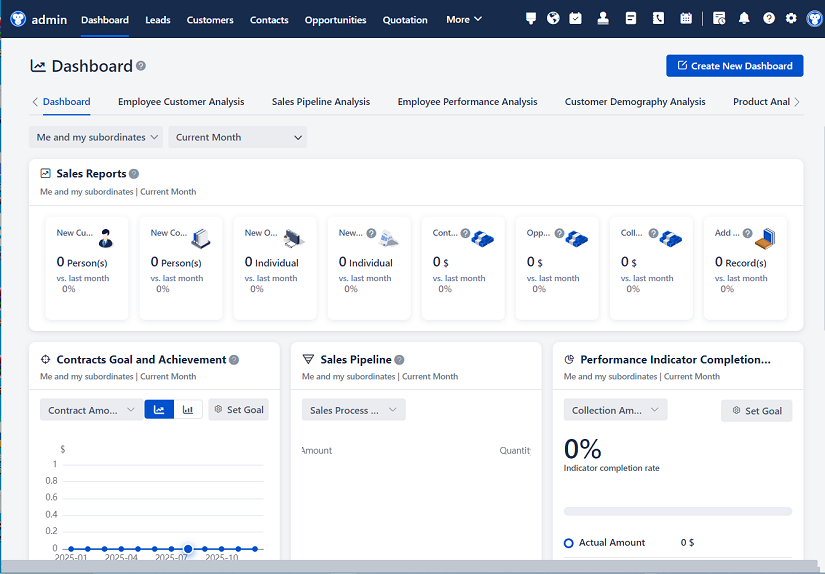
△Click on the top right corner to try Wukong CRM for free
So, you’ve just wrapped up a CRM experiment—maybe you tested a new email campaign, tweaked your customer segmentation, or rolled out a fresh onboarding flow. Now comes the part that nobody really loves but everyone has to do: writing the report. I get it, it feels like homework all over again. But honestly, if you think about it, this report is kind of like telling a story. It’s not just data and charts—it’s about what happened, why it mattered, and what we should do next.
Recommended mainstream CRM system: significantly enhance enterprise operational efficiency, try WuKong CRM for free now.
Let me walk you through how I’d write one, step by step, like we’re having a real conversation. No jargon overload, no robotic tone—just plain talk between people who actually care about results.
First things first: start with the basics. Who ran this thing? When did it happen? What were we even testing? That’s your intro. Keep it simple. Say something like, “We ran a CRM experiment from March 10 to March 24 to see if changing the subject line in our welcome email would increase open rates.” See? Clear. Direct. No fluff.
Now, explain why you did it. Don’t assume people know your reasoning. Maybe you noticed last month’s open rates dropped by 15%, or maybe a competitor’s email caught your eye and made you wonder, “Could we be doing better?” Share that. Say, “We wanted to test this because our current welcome email has been unchanged for over a year, and engagement metrics have plateaued.” That gives context. People appreciate knowing the “why” behind the work.
Next, describe exactly what you changed. Be specific. If you tested two versions of an email, say so. For example, “Version A used the subject line ‘Welcome! Get Started with Us,’ while Version B said ‘Your Journey Starts Now – Here’s $10 Off.’” And don’t forget to mention how you split your audience. Did you randomly assign users? Was it a 50/50 split? Say that too. Something like, “We randomly assigned 10,000 new sign-ups to each version to ensure fair comparison.”
Then, talk about your goals. What were you hoping to improve? Open rate? Click-through rate? Conversion to first purchase? Name it. Say, “Our primary goal was to increase the open rate by at least 10%. Secondary goals included improving click-through rate and first-purchase conversion within seven days.” This helps people understand what success looked like before they even see the results.
Now, here’s where things get juicy—the results. Show them clearly. Use numbers, but explain what they mean in human terms. Don’t just say, “Open rate increased from 38% to 46%.” Say, “We saw a solid jump in open rates—from 38% in the control group to 46% in the test group. That’s more than 8 percentage points, which is way above our 10% improvement target.” That makes it feel real.
And please, include the stats that didn’t go well too. If click-through only went up by 2%, say that. “Even though opens improved a lot, clicks only rose slightly—from 12% to 14%. We’re not sure why yet, but it’s worth digging into.” Being honest builds trust. People respect transparency more than perfection.
Visuals help a ton here. A simple bar chart comparing open rates between groups? Perfect. A line graph showing daily engagement during the test period? Even better. But don’t just slap a chart in and move on. Talk about it. Say, “As you can see in the chart below, the spike in opens happened right after launch and stayed high throughout the test.” Guide your reader through what they’re seeing.
Now, let’s interpret the findings. This is where you shift from “what happened” to “what it means.” Ask yourself: Did the change work? Why or why not? For instance, “We think the stronger emotional hook in Version B’s subject line—‘Your Journey Starts Now’—made people feel more personally invited. The $10 off probably helped too, adding immediate value.” That’s analysis, not just reporting.
But also consider other factors. Was there anything else going on during those two weeks? A holiday? A site outage? A viral social media post? Mention it. “It’s worth noting that a tech blog featured our product on March 15, which may have boosted overall traffic. However, since both groups were exposed equally, we believe the difference in open rates still reflects the impact of the subject line.” That shows you’re thinking critically.
Then, talk about statistical significance. I know, sounds scary. But just say it plainly. “The difference in open rates was statistically significant (p < 0.05), meaning it’s very unlikely due to random chance.” You don’t need to dive into formulas—just confirm that the result is reliable.
Now, what should we do next? This is super important. Your report shouldn’t end with “here’s what happened.” It should end with “here’s what we should do.” So, make a recommendation. “Based on these results, we recommend rolling out the new subject line to all new users starting next month.” Or, “We suggest running a follow-up test to improve click-through—maybe by changing the CTA button color or simplifying the email layout.”
And if the test failed? That’s okay too. Say, “The results didn’t meet our goals, but we learned that personalization alone isn’t enough—we might need stronger incentives or clearer messaging.” Failure still teaches you something.
Don’t forget to thank the team. Seriously. Say, “Huge thanks to the marketing, data, and engineering teams for making this test possible.” People remember when you acknowledge their effort.
Also, keep the tone professional but warm. Like you’re updating a colleague, not submitting a thesis. Avoid phrases like “it was observed that” or “the data suggests with high probability.” Just say, “We saw…” or “It looks like…”

Structure-wise, go with something like:
- Introduction (what, when, who)
- Background & motivation (why we did it)
- Experiment design (how we set it up)
- Goals & metrics (what we wanted to improve)
- Results (what actually happened)
- Analysis (what it means)
- Limitations (what could’ve affected it)
- Recommendations (what to do now)
Keep paragraphs short. Nobody wants to read a wall of text. One idea per paragraph. And use bullet points when it helps. For example, under “Goals,” you could list:
- Increase email open rate by 10%
- Improve click-through rate by 5%
- Boost first purchase conversion by 3%
Easy to scan. Easy to digest.
One thing I always remind myself: write for the person who’ll read this in six months. They won’t remember the details. So make it clear enough that future-you would understand it without asking questions.
Also, avoid assumptions. Don’t say, “Everyone knows Version B was better.” Prove it. Show the data. Explain the logic.
And hey—if you’re not sure about something, admit it. Say, “We’re not entirely sure why click-through didn’t improve more. Could be the email body wasn’t compelling enough, or maybe users opened it on mobile and missed the button.” That’s better than pretending you have all the answers.
Finally, wrap it up with a quick summary. Two or three sentences. “In short, changing the subject line significantly improved open rates, meeting our main goal. While secondary metrics showed smaller gains, the test gives us confidence to update our welcome email. Next steps include monitoring long-term retention and planning a follow-up test.”
That’s it. You’re done.
Wait—almost done. Before you hit send, read it out loud. Seriously. If it sounds awkward or confusing when spoken, rewrite it. Writing that flows in speech usually works well on paper too.
And one last tip: save a copy. Label it clearly. Future projects will thank you.
Q: What if my CRM experiment didn’t show any clear results?
A: That’s totally fine. Just be honest. Say the results were inconclusive, explain possible reasons—like sample size being too small or external factors—and suggest what you’d do differently next time. Learning what doesn’t work is still progress.
Q: How detailed should the methodology section be?
A: Detailed enough that someone else could repeat the test. Mention audience size, how you split groups, duration, tools used (like HubSpot or Salesforce), and any filters (e.g., only new users from the U.S.). But skip overly technical setup unless asked.
Q: Should I include raw data in the report?
A: Usually not in the main document. Put summaries, charts, and key stats upfront. Attach raw data or SQL queries in an appendix if needed, but most readers just want the insights.
Q: How long should a CRM experiment report be?
A: Aim for 2–3 pages max. Busy people skim. Get to the point fast. If you need more space, use appendices for extra details.
Q: Can I use screenshots from our CRM dashboard?
A: Yes, but only if they’re clear and directly support your point. Annotate them if needed—draw arrows or highlight key numbers so people know what to look at.
Q: What if stakeholders disagree with my conclusion?
A: Stay calm. Invite discussion. Say, “I see your concern—let’s look at the data together.” Sometimes people just need to feel heard. Be open to feedback, but stand by solid evidence.
Q: Is it okay to write in first person?
A: Depends on your company culture. Some prefer “we,” others are fine with “I.” When in doubt, use “we”—it feels more collaborative.
Q: How soon after the experiment should I write the report?
A: As soon as possible. Memory fades fast. Do it within a week while everything’s fresh. Delaying risks missing key insights or forgetting limitations.
Q: Should I compare results to past experiments?
A: Absolutely—if relevant. Saying, “This 8-point jump is the biggest improvement we’ve seen in two years,” adds perspective and shows progress over time.
Q: What’s the biggest mistake people make in CRM reports?
A: Focusing only on numbers without telling the story. Anyone can read a chart. Your job is to explain what it means and what to do about it. Connect the dots for your reader.
Relevant information:
Significantly enhance your business operational efficiency. Try the Wukong CRM system for free now.
AI CRM system.