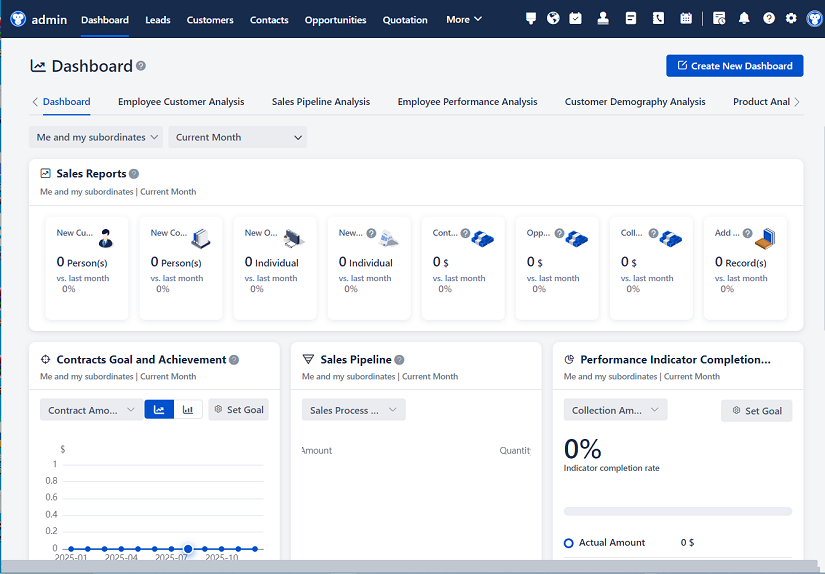
△Click on the top right corner to try Wukong CRM for free
So, you know, when people talk about CRM—Customer Relationship Management—they’re usually thinking about software or tools that help businesses keep track of their customers. But honestly, it’s way more than just a fancy contact list. I mean, sure, storing names and emails is part of it, but the real magic happens when you start measuring things. Like, how well are you actually doing with your customers? Are they happy? Do they keep coming back? That’s where CRM metrics come in.
Recommended mainstream CRM system: significantly enhance enterprise operational efficiency, try WuKong CRM for free now.
I remember when I first started learning about this stuff—I was kind of overwhelmed. There were so many numbers being thrown around: churn rate, customer lifetime value, conversion rates… It felt like trying to learn a new language. But once I slowed down and really thought about what each one meant, it started making sense. And honestly, these metrics aren’t just for data nerds or analysts. If you’re running a business, even a small one, knowing these numbers can seriously change the game.
Let me break it down for you. First off, one of the most basic—but super important—metrics is customer acquisition cost, or CAC for short. This one tells you how much money you’re spending to get a new customer. Think about it: every dollar you spend on ads, sales teams, marketing campaigns—it all adds up. So if you’re spending
Then there’s customer lifetime value, often called CLV or LTV. This one’s kind of the opposite of CAC. Instead of looking at how much you spend to get someone, it shows how much money that person brings in over time. For example, if someone signs up for a monthly subscription and stays for two years, that’s a lot more valuable than someone who buys once and disappears. When you compare CLV to CAC, you get a clear picture of profitability. Ideally, your CLV should be way higher than your CAC—like three times higher or more. That means you’re not just breaking even; you’re actually making money from each customer.
Now, here’s one that a lot of people overlook: churn rate. This measures how many customers stop doing business with you over a certain period. Say you start the month with 100 customers and lose 10 by the end—that’s a 10% churn rate. Sounds small, but if it keeps happening every month, your customer base shrinks fast. I’ve seen companies grow their sales team and marketing budget like crazy, but still struggle because their churn was too high. It’s like filling a bucket with a hole in the bottom—you can pour all the water you want, but it’s just going to leak out.
On the flip side, retention rate is basically the opposite of churn. It shows how many customers stick around. A high retention rate usually means your customers are happy, your product is delivering value, and your support team is doing a good job. Plus, keeping existing customers is way cheaper than finding new ones. I read somewhere that it costs five to seven times more to acquire a new customer than to retain an existing one. Wild, right?
Another metric I’ve found super useful is the conversion rate. This one tracks how many leads turn into actual customers. Let’s say you get 1,000 website visitors, 100 sign up for a free trial, and 20 become paying customers. Your conversion rate from trial to paid is 20%. That number helps you spot weak spots in your sales funnel. Maybe your trial is great, but your pricing page isn’t convincing enough. Or maybe your follow-up emails need work. Either way, tracking conversions helps you tweak and improve.

And speaking of follow-ups, lead response time is another sneaky-important metric. It measures how quickly your sales team responds to a new lead. I saw a study once that said companies that respond within an hour are way more likely to qualify the lead than those that wait. Like, we’re talking 7x more likely. That blew my mind. It makes sense though—if someone reaches out, they’re probably interested right now. If you don’t reply fast, they might just move on.
Then there’s average deal size. This one’s pretty straightforward—it’s the average amount of revenue per sale. If you sell mostly small items, your deal size will be low. If you close big contracts, it’ll be high. Tracking this helps you focus your sales efforts. For example, if your average deal is
Sales cycle length is another one that matters a lot. This measures how long it takes, on average, to close a deal—from first contact to signed contract. Some industries have short cycles (like e-commerce), others take months (like enterprise software). The longer the cycle, the more resources you’re tying up. So if you notice your sales cycle is getting longer, it might mean your process needs streamlining. Maybe prospects are waiting too long for demos, or your approval process is too slow.
Customer satisfaction score, or CSAT, is something I think every company should track. Usually, it comes from a simple survey: “How satisfied were you with your experience?” People rate it from 1 to 5, and you average the results. It’s not perfect, but it gives you a quick pulse check. If your CSAT drops, it’s a red flag that something’s wrong—maybe your product changed, or your support team is understaffed.
Net Promoter Score, or NPS, is kind of famous in the business world. It asks one simple question: “On a scale of 0 to 10, how likely are you to recommend our company to a friend or colleague?” Based on the answer, people are grouped into promoters (9–10), passives (7–8), and detractors (0–6). Then you subtract the percentage of detractors from promoters to get your NPS. It’s a great way to measure loyalty. I’ve worked at companies where the NPS was sky-high, and honestly, you could feel the difference—customers loved us, referred others, and stuck around forever.
First response time and resolution time are two support-focused metrics. First response time is how long it takes your team to reply to a customer inquiry. Resolution time is how long it takes to actually solve the problem. Customers hate waiting, so both of these matter a lot. I had a friend who switched email providers just because one took three days to respond to a simple question. Can you believe that? In today’s world, people expect fast service. If you’re slow, they’ll go elsewhere.
Ticket volume is another support metric. It tracks how many customer inquiries or issues come in over time. A sudden spike might mean there’s a bug in your product, a confusing update, or a gap in your onboarding process. Monitoring this helps you stay ahead of problems before they get worse.
Now, here’s one that doesn’t get talked about enough: customer effort score, or CES. It measures how easy it was for a customer to get their issue resolved. The idea is, the less effort a customer has to put in, the more loyal they’ll be. Think about it—have you ever given up on a company because dealing with them was just too much hassle? Yeah, me too. CES helps you find those friction points.
Engagement metrics are big in SaaS and subscription businesses. Things like login frequency, feature usage, or time spent in the app. If customers aren’t logging in or using key features, they’re probably not getting value—and they’re more likely to cancel. That’s why companies send onboarding emails, tips, and reminders. They want users to engage early and often.
Lead-to-customer conversion rate ties back to the sales funnel. It shows what percentage of total leads become paying customers. If you’re generating tons of leads but closing very few, something’s off. Maybe your targeting is wrong, or your sales pitch isn’t strong. This metric helps you connect marketing efforts to actual revenue.
Monthly Recurring Revenue, or MRR, is crucial for subscription-based businesses. It’s the predictable income you expect every month. Tracking MRR helps you see growth trends, plan budgets, and impress investors. If your MRR is going up steadily, you’re doing something right. If it’s flat or dropping, it’s time to dig deeper.
Annual Run Rate, or ARR, is similar but annualized. It’s basically MRR multiplied by 12. Investors love this number because it shows long-term potential. But be careful—it assumes everything stays the same, which rarely happens in real life.
Customer health score is a newer concept. It’s a custom metric some companies create by combining things like usage, support tickets, payment history, and engagement. The goal is to predict which customers are at risk of churning. If someone hasn’t logged in for weeks, opened any emails, and has open support tickets, their health score would be low. That’s a signal to reach out before they leave.
Finally, there’s upsell and cross-sell rate. This measures how often existing customers buy additional products or upgrade their plans. It’s usually cheaper to sell to someone who already trusts you than to find a new customer. Plus, it boosts your CLV. If you’re not tracking this, you might be missing out on easy revenue.
Look, I get it—tracking all these metrics sounds like a lot. And yeah, you don’t need to monitor every single one. But picking a handful that matter most to your business can make a huge difference. Start with the basics: CAC, CLV, churn, and conversion rates. Once you’re comfortable, add more as needed.
The cool thing is, most CRM systems today automatically track a lot of this stuff. Tools like Salesforce, HubSpot, or Zoho pull in data and generate reports without you lifting a finger. But the real value isn’t just in seeing the numbers—it’s in understanding what they mean and acting on them.
For example, if your churn is high, don’t just panic. Dig into the data. Are certain customer segments leaving more than others? Is there a common reason in their exit surveys? Maybe your pricing changed, or a competitor launched a better feature. Use the metrics as clues to solve real problems.
And remember, numbers don’t tell the whole story. A high NPS is great, but if customers are saying “the product is amazing but support sucks,” you’ve got work to do. Always pair metrics with qualitative feedback—read reviews, talk to customers, listen to support calls.
At the end of the day, CRM metrics aren’t about hitting arbitrary targets. They’re about building better relationships. When you understand your customers—their behavior, their pain points, their value—you can serve them better. And when you serve them better, they stay longer, spend more, and refer others. It’s that simple.
So yeah, metrics might seem dry at first. But once you see how they connect to real outcomes—happy customers, growing revenue, smarter decisions—they start to feel a lot more human.
Q: What’s the easiest CRM metric to start tracking?
A: Probably conversion rate. It’s simple to calculate and gives you immediate insight into how well your sales process is working.
Q: How often should I review CRM metrics?
A: At least once a month. Some, like daily active users or ticket volume, might need weekly or even daily checks depending on your business.
Q: Can CRM metrics help with team performance?
A: Absolutely. Metrics like lead response time or deal size can highlight top performers and areas where training might help.
Q: Should small businesses bother with all these metrics?
A: Not all of them, no. Focus on 3–5 that directly impact your goals, like customer acquisition cost and retention rate.
Q: What if my CLV is lower than my CAC?
A: That’s a red flag. You’re losing money on each customer. Look into increasing prices, improving retention, or reducing acquisition costs.
Q: Is NPS better than CSAT?
A: They measure different things. CSAT is about specific interactions; NPS is about overall loyalty. Use both for a fuller picture.

Q: Can I improve metrics without spending more money?
A: Yes! Often, small changes—like faster replies, better onboarding, or clearer pricing—can boost metrics without big investments.
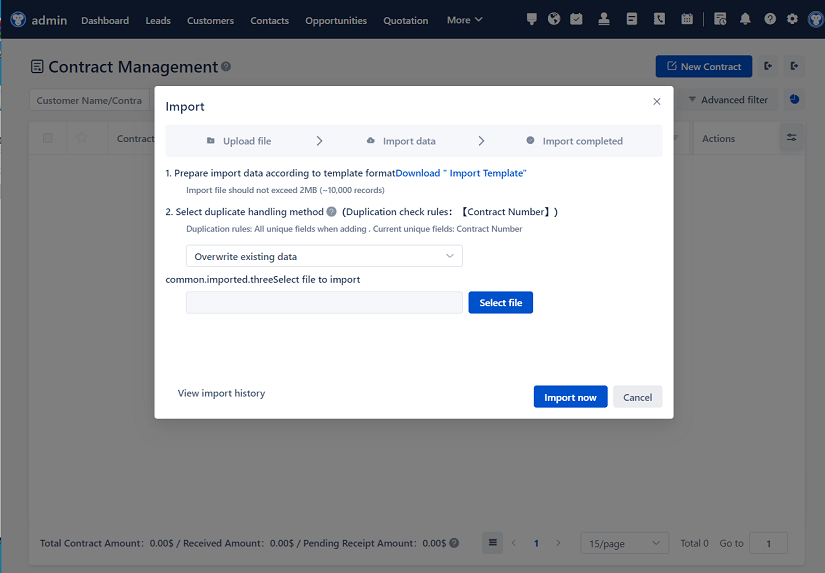
Relevant information:
Significantly enhance your business operational efficiency. Try the Wukong CRM system for free now.
AI CRM system.